Hi TI Customer Support,
I am using AWR 1243 BOOST with DCA1000EVM capture board. I have a question.
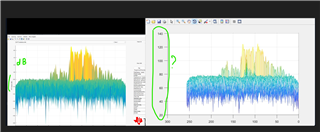
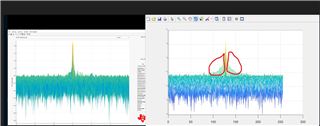
1. I built a user app in Python programming to capture raw data from an AWR1243BOOT using a DCA1000EVM capture card. I collected successful raw data and processed 1-D FFT (Range-profile) in real-time. However, when I process FFT 2-D then have problems with the result. The figure below is the result (static environment) when I ran the app in real-time:
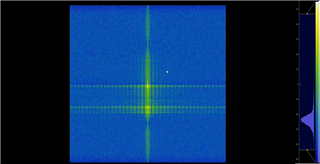
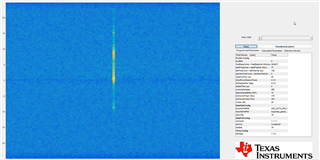
In a static environment, the result must be like in mmwave studio in the Figure below:
- Did I process FFT 2D incorrectly? Below is the MATLAB code for the FFT-2D processing I used:
function [out_dBFS] = fft_2d(adc_Data) % size adc_Data [Num. of chirp Loops ADC samples] - complex data type
Hann_win = hanning(256)';
f1 = adc_Data.*Hann_win;
fft_2 = fft2(f1);
out_fft2d = abs(fftshift(fft_2));
out_dBFS = 20*log10(out_fft2d);
end
Hann_win = hanning(256)';
f1 = adc_Data.*Hann_win;
fft_2 = fft2(f1);
out_fft2d = abs(fftshift(fft_2));
out_dBFS = 20*log10(out_fft2d);
end
P/S: ADC samples = 256; Num. of chirp Loops = 255.

Regards,
Tuan Trinh The