This thread has been locked.

If you have a related question, please click the "Ask a related question" button in the top right corner. The newly created question will be automatically linked to this question.

IWR6843AOPEVM: How to interpret data from UART?

Genius 17475 points
Part Number: IWR6843AOPEVM

Hi Experts,

Seeking your assistance on this query about IWR6843AOPEVM:

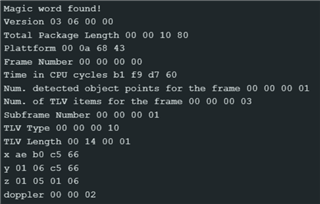
My team is trying to make a (distance to ground measurement thing) and we are using the level sensing demo to get the Data to the UART interface.
My question how I interpret the data from the Uart? (Only the Data port, the Config port is text based).
I assume the port(s) is part of the mmwaveLink protocol, am I correct?
And as a follow up is there a way to send the Data (and / or Config) over SPI/I2C?

Thank you.

Regards,
Archie A.

  • Hi,

    My question how I interpret the data from the Uart?

    Please see this similar post: https://e2e.ti.com/support/sensors-group/sensors/f/sensors-forum/1166858/iwr6843aop-how-is-the-information-parsed-into-the-visualizer-when-running-a-lab 

    And as a follow up is there a way to send the Data (and / or Config) over SPI/I2C?

    Yes, this is possible. The SPI/I2C are accessible from MSS. Unfortunately we do not have an example which uses SPI/I2C to send the config or output data but you can refer to the test code @ <SDK_INSTALL>\packages\ti\drivers\i2c\test\xwr68xx and 

    <SDK_INSTALL>\packages\ti\drivers\spi\test\xwr68xx.

    Best Regards,

    Josh

  • Hello Josh,

    Thanks for the guidance. Cx responded:

    The spi/i2c test code was helpful but the interpretation of the data isn't quite correct.
    We get 16 (hex 10) as the tlf type which i can't find in the doc.

    Any further support?

    Regards,
    Archie A.

  • Archie,

    Some questions below.

    1. Which version of the Industrial Toolbox is being used? 

    2. Level Sensing demo is being used, correct? Has there been modifications to the MmwDemo_transmitProcessedOutput() function? 

    3. Is there only one TLV received each frame with type = 16 or are multiple TLVs of different types received? The level sensing demo should output 3 different TLVs which are Detected Points (type = 1), Range Profile (type = 2), and Stats (type = 6). Do they see these TLVs?

    4. What method is used to view the output data? For example, Is a parsing script being used?

    Best Regards,

    Josh

  • Hi Josh,

    Cx responded:

    [1] version 4.1
    [2] Yes, we are using the demo. No, we haven't modified it.
    [3] See 4. If you look a the image one can see that the header says that ther are indeed three tlvs in this frame.
    [4] we are trying to write our on parsing script (for a esp32 so in arduino) but as far a i can tell the responsible group member didnt properly read the tlv header so..

    Our group will work in this again this Friday so give you an update as soon as we have one (or on Friday). This is a (space & line brakes added) example of our Data:

    0201040306050807
    00 00 06 03
    80 10 00 00
    43 68 0A 00
    00 00 00 00
    B1 F9 d7 60
    01 00 00 00
    03 00 00 00
    01 00 00 00
    10 00 00 00
    01 00 14 00
    B4 36 0D 83
    0D 83 36 00
    37 00 37 00
    02 00 00 00
    00 10 00 00
    .
    .
    .

    Thank you.

    Regards,
    Archie A.

  • Hello Josh,

    Cx asked an update and has following response.

    is there any additional information for parsing for the High Accuracy Range Measurement Lab as it doesnt seem to follow the normal formating. we are especially intereste in how to extract the float distanz allows as sent by part of the MmwDemo_transmitProcessedOutput:

    /* Send detected Objects */
    {
    MmwDemo_output_message_dataObjDescr descr;
    MmwDemo_detectedObj dummyDetectionOut;
    int32_t tempRange, tempRange1, tempRange2;

    memset((void *)&dummyDetectionOut, 0, sizeof(MmwDemo_detectedObj));

    tempRange = (int32_t)(outputData->rangeEst * 1048576.f);
    tempRange1 = (int32_t)(outputData->rangeEst1 * 1048576.f);
    tempRange2 = (int32_t)(outputData->rangeEst2 * 1048576.f);


    dummyDetectionOut.rangeIdx = (uint16_t) tempRange & 0xFFFF;
    dummyDetectionOut.x = tempRange >> 16;

    ...
    dummyDetectionOut.peakVal = (uint16_t) tempRange1 & 0xFFFF;
    dummyDetectionOut.y = tempRange1 >> 16;

    dummyDetectionOut.dopplerIdx = (uint16_t) tempRange2 & 0xFFFF;
    dummyDetectionOut.z = tempRange2 >> 16;

    UART_writePolling (uartHandle,
    (uint8_t*)&tl[tlvIdx],
    sizeof(MmwDemo_output_message_tl));
    /* Send objects descriptor */
    descr.numDetetedObj = 1;
    descr.xyzQFormat = 20;
    UART_writePolling (uartHandle, (uint8_t*)&descr, sizeof(MmwDemo_output_message_dataObjDescr));

    /*Send array of objects */
    UART_writePolling (uartHandle, (uint8_t*)&dummyDetectionOut, sizeof(MmwDemo_detectedObj) * 1);
    tlvIdx++;

    we have found the object descriptor in data but cant get any thing usefull out of the other data.
    0100 1400 object descriptor
    0166 AC02
    D902 1700
    0500 2000

    the distance should be ~2.0001m, as far as we could pice together 0x00176601 should get the first data point
    aka ~2 m

    I have found a mistake in the way the mmWaveSensingEstimator reads the high_accuracy_demo_68xx.cfg because there are two space the Estimator skips one index (which the lab doesn't do / High Accuracy Visualizer sees it correct to) see fotos.

    see the 2 dots aka spaces (infrom of 33.71)

    Regards,
    Archie A.

  • Hi Archie,

    is there any additional information for parsing for the High Accuracy Range Measurement Lab

    Please see the level sensing user guide for information on the lab's outputs. Additionally, the source code for this lab's GUI is available at https://dev.ti.com/gallery/, you can refer to this to see how the data is parsed and visualized.

    we are especially intereste in how to extract the float distanz allows

    I apologize, but I do not quite understand what is meant here. Could you please elaborate?

    I have found a mistake in the way the mmWaveSensingEstimator reads the high_accuracy_demo_68xx.cfg because there are two space the Estimator skips one index (which the lab doesn't do / High Accuracy Visualizer sees it correct to) see fotos.

    Thank you for notifying us of this! I have been able to replicate this on my end. It appears to be a bug with the Sensing Estimator Tool. This will be fixed in a future release. For now you can remove the extra space from the .cfg file.

    Best Regards,

    Josh

  • Hi Archie, 

    Along with the resources that Josh has provided, the user can also download the source code for the visualizer for this lab from dev.ti.com/gallery and use the parser from that visualizer as a point of reference.

    Best Regards,
    Alec

  • Hello Alec,

    Apology for the delayed response. Customer wanted to have further assistance:

    I want to apologize for the long time it took me to get back to you and the lack of proper English I used in this conversation this so far.
    Second, I would like to thank you for your team's help. Me/My team didn’t know the GUI had public source code. This helped us getting us on parser to work properly.

    One thing isn’t 100% clear to us:
    Does the High Accuracy Range Measurement Lab misuse the “Detected Points” TLV in a non-documented way? This isn’t per say a problem, but it isn’t mentioned in any part of the lab / any other doc (except for the code oc.) as far as we can tell. The Rest of the documentation is good if you can find what you’re looking for.

    Thank you.

    Regards,
    Archie A.

  • Archie,

    Yes, this is the case. Admittedly it can be a bit confusing, and is something we are considering updating in the future.

    Best Regards,
    Alec