This thread has been locked.

If you have a related question, please click the "Ask a related question" button in the top right corner. The newly created question will be automatically linked to this question.

AWR1843BOOST: Grouping or Not Grouping

Part Number: AWR1843BOOST
Other Parts Discussed in Thread: AWR1843

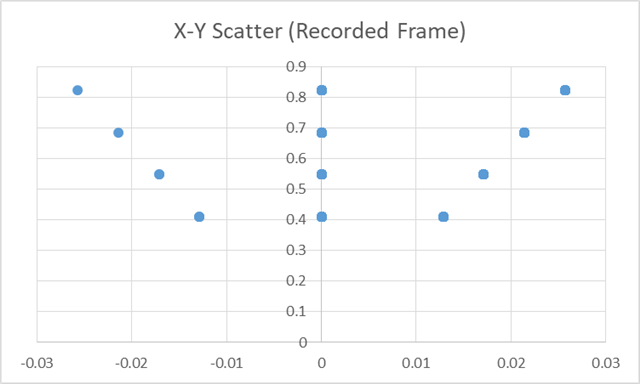
The object has a thickness of 1 cm and an area of 6 x 30 cm^2.


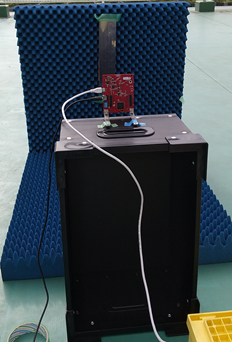
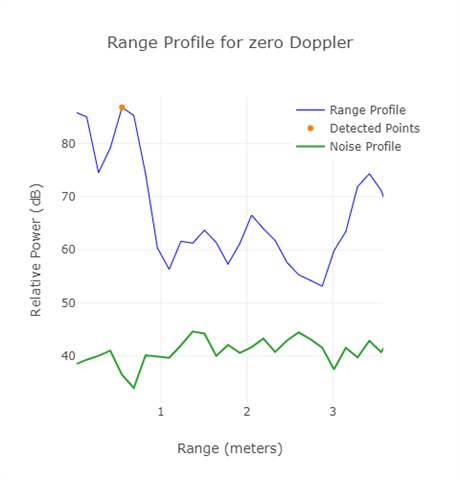
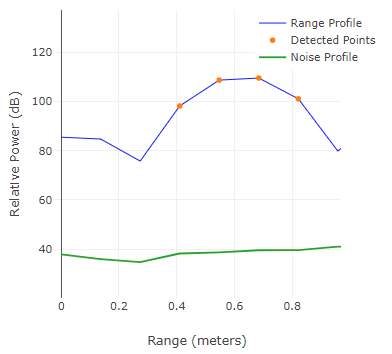
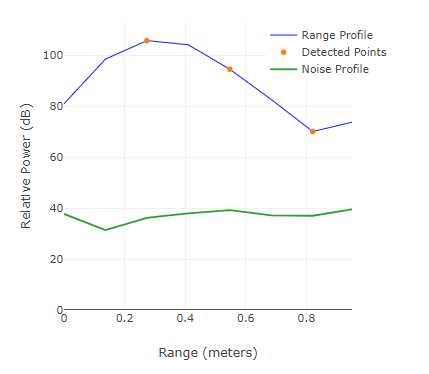
When measuring in mmWave Demo Visualizer, the image looks different when Grouping is disabled and enabled.

Please let me know the reason why multiple is visible when Grouping is disabled.

  • Hi Hiroyuki-san,

    Peak grouping is an algorithm used to group neighboring points together and clump them as a single point such that your effective number of detected points are reduced. This is the reason why you are seeing many points when you are disabling peak grouping.

    Regards,

    Kaushik

  • Hi, thanks for your reply.

    This is quick, but is the reason why multiple peaks appear when grouping is disabled because the area of the object is large?

    Even if you look at the ScatterPlot, multiple points appear on the y axis.

  • Hi Hiroyuki-san,

    In a sense, yes, the number of points you obtain in your point cloud will be directly proportional to the area of the reflector within the FOV of the sensor. A wider reflector should induce more peaks corresponding to different R & theta which will be picked up as detections by the CFAR algorithm. Please note that the point cloud generated will be affected by many parameters such as resolution, CFAR cfg etc.

    Regards,

    Kaushik 

  • Thank you for your reply.

    Please tell me how to reduce the point cloud other than enabling grouping. (FoV etc.)

  • Hi Hiroyuki-san,

    Some ways in which you can reduce your point cloud would be to fine tune your CFAR configurations (threshold, window sizes etc.). You can also reconfigure your radar profile to scale down your resolution and number of samples. May I know what your use case is so that my suggestions are more aligned to your needs?

    Regards,

    Kaushik

  • Hi, thanks for your reply.

    I'll check the method you suggested as soon as possible.
    By the way, the reason why the point cloud appears is that there is a possibility that some of the places where peaks appear in the frequency spectrum that appears after Range-FFT may be detected objects, other than the area.

    (p.s.)
    What I'm trying to use is a short-range radar.

    Maximum detection distance: 20 m
    Maximum detected speed: 25 km/h
    Distance resolution: 0.04 m
    Velocity resolution: 0.3 km/h.

  • In addition, I would like to ask you, after all, what are the advantages and disadvantages of actually looking at point clouds?
    ⇒This is because I was wondering if Grouping would be necessary when using it as a radar.

    Next, I used it with Grouping disabled, but when the range resolution changed, the interval between peaks and the width of the detected object also changed.
    Is this correct that the axis of the Range-Profile is carved for each resolution?

    Grouping is invalid ⇒ Considered as a detected object for each distance resolution at several points that are likely to be peaks.


    Range resolution of 0.1370

    (From left to right:0.4109 m, 0.5478 m, 0.6848 m, 0.8217 m)


    Range resolution of 0.2740

    (From left to right:0.2739 m, 0.5478 m, 0.8217 m)

    Finally, if Grouping is disabled and the coordinates are the same on the Y axis but different on the X axis, is the angle the same?
    (The graph after the conversion file is shown below.)

    When different X coordinates appear on the same Y axis, does the angular resolution of the azimuth angle work?

  • Hi Hiroyuki-san,

    Please find my replies to your questions.

    what are the advantages and disadvantages of actually looking at point clouds?

    A point cloud would produce a much more descriptive representation of the surrounding which is essential for many of the applications possible with the help of the radar sensor. The tradeoff with a denser point cloud is that point cloud processing algorithms become computationally more expensive and sometimes unnecessary for your application. In the end, you can chalk it down to your end use case.

    Is this correct that the axis of the Range-Profile is carved for each resolution?

    Yes, your understanding is correct.


    Regarding your last question, is it possible to rephrase the same?

    Thanks & regards,

    Kaushik

  • Hi, thanks for your reply.

    Your story can be summed up like this
    ・About point cloud
    "If you want to see in detail how the object is reflected in the point cloud, you use the point cloud."

    ・About Range-Profile
    Since it is engraved for each resolution, it means that the distance resolution must be set in order to detect the distance at a more accurate position.

    (p.s.)
    If you don't mind, please tell me an example of chirp waves and chirp frames to meet the following conditions.

    Maximum detection distance: 20m
    Maximum detected speed: 25km/h
    Distance resolution: 0.04m
    Velocity resolution: 0.3km/h.

  • In addition, I would like to ask, is the Range-Profile step possible and separated by distance only done by Visualizer?
    Or does the AWR1843 itself have such specifications?

  • Hi Hiroyuki-san,

    Your understanding here is correct. Regarding the configuration you are asking about, I highly recommend you go through the following document to get the correct profile and chirp parameters.

    Programming Chirp Parameters in TI Radar Devices (Rev. A)

    Alternatively, you can also use the mmWave sensing estimator tool:

    mmWaveSensingEstimator

    Regards,

    Kaushik