Hi,
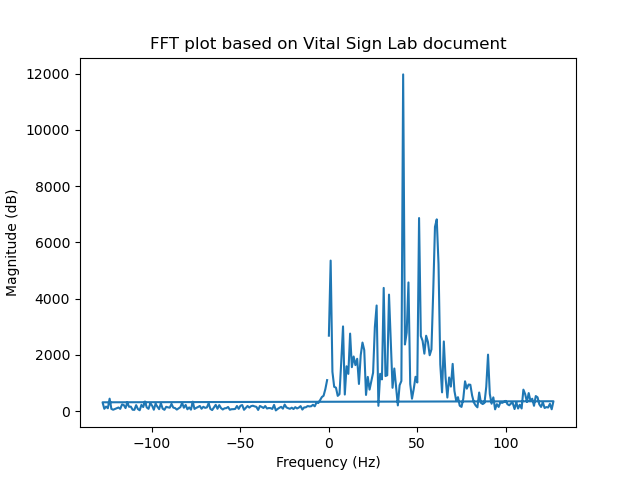
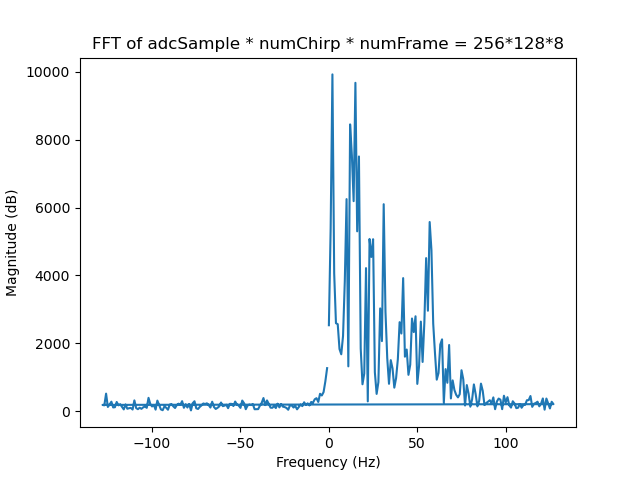
I collected the data using IWR1443Boost EVM and converted them into a matrix using TI MATLAB code. Thereafter, I deleted three rows out of four collected for each receiver(RX). I reshaped the data and filled it up and down to make the data as shown in this thread image(Thread for 1D FFT). Finally, I performed the FFT along the row as discussed in the thread and generated the below plot. I also plotted the FFT following the vital sign lab(version 1.4)(link to vital sign lab) instructions provided on page 7. The collected data configuration was: Numer of Chirp loop=128, Number of frames=8, and ADC samples=256.


I would be grateful if you could check which generated FFT plot is correct. I am curious why these two plots are different.
As a beginner, I am totally unaware of the detailed data structure of a given EVM and how to process those data for provided applications like vital sign recognition, people counting, etc. I read the documents on SDK, mmwave studio, ADC raw data capture, Programming Chirp parameter, and vital sign lab pdf(version 1.4). However, I could not find a detailed way how to process the radar data like applying FFT(1,2 or 3D). It would be great if I could be shown how to process the data well.
Regards
Deepu


