This thread has been locked.

If you have a related question, please click the "Ask a related question" button in the top right corner. The newly created question will be automatically linked to this question.

DCA1000EVM: I want to create a 2d fft image through the captured raw data.

Part Number: DCA1000EVM
Other Parts Discussed in Thread: IWR6843ISK-ODS

Hi TI Customer Support, 

I am a beginner student studying radar. So please escuse me if the question is a bit stupid.

I am using IWR6843ISK-ODS with DCA1000EVM capture board. I have a question.

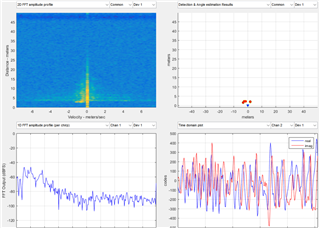
First, I was able to check the corresponding result through the mmwave studio.

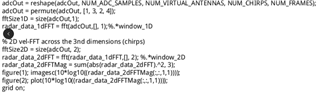
For machine learning, I intend to produce the above "2d fft image" through MATLAB. 

This is to be solved by accessing raw data by referring to the document swra581b (9.2).

Therefore, I modified the MATLAB Example as follows.

-------------------------------------------------------------------------------

% return receiver data
retVal = adcData(1:4, 1:32768);
fft_out = fft2(retVal);
fft_out = abs(fftshift(fft_out));
fft_out = 20*log10(fft_out);

-------------------------------------------------------------------------------

ADC Bits 16, complex1x, ADC sample 256, No of chirp Loops: 128, No of frame 8

I followed the above specifications, so 32768(ADC sample(256) x No. of chirp(128)) data in one frame.

But I can't see the same image in MATLAB as I saw in mmwave studio.

What is wrong?

  • Hi,

    Thanks for reaching out on our e2e forums! Can you please share what your image looks like in matlab?

    Thanks,

    Angie

  • Thank you for your apply

    As I said, This image is the result of modifying the last part of the MATLAB example in swra581b(9.2).

    Thanks,

    Yeon Woo.

  • Hi,

    The adcData will need to be reshaped per chirp and per number of antennas. An example of using the reshape function can be seen in the 9.2 example already. This function will need to be used to organize the ADC samples by antenna and by chirp.

    I would recommend doing the fft in two steps, first do an fft per chirp / per antenna and then perform the second fft. 

    Thanks,

    Angie 

  • Maybe I don't quite understand what you're saying.

    First, this part is added to the example 9.2. according to your reply.

    %organize data per RX
    adcData = zeros(numRX,numChirps*numADCSamples);
    for row = 1:numRX
        for i = 1: numChirps
            adcData(row, (i-1)*numADCSamples+1:i*numADCSamples) = LVDS(i, (row-1)*numADCSamples+1:row*numADCSamples);
        end
    end
    
    % ADC data per frame
    adcData = adcData(1, 1:numADCSamples*numChirps);
    adcData = reshape(adcData, [numADCSamples, numChirps]);
    
    % return receiver data
    fft_out = fft2(adcData, numADCSamples, numChirps);
    fft_out_test = fft_out;
    fft_out = abs(fftshift(fft_out));
    fft_out = 20*log10(fft_out);
    
    %plot
    figure(1)
    imagesc(fft_out)

    As a result, I was able to obtain the following image.

    However, it is still different from the 2d fft image seen in the mmwave studio. 

    So, I want to know 

    I would recommend doing the fft in two steps, first do an fft per chirp / per antenna and then perform the second fft

    1. Is this different from the process of going through 2d fft?

    2. And is there any github that I can refer?

    Thanks,

    YeonWoo

  • Hi YeonWoo,

    Please keep in mind that the coloring in matlab may not be exactly the same as the coloring in studio. This looks like it may be correct but with both axes flipped.  Below is a code snippet that may help explain what I mean by "I would recommend doing the fft in two steps, first do an fft per chirp / per antenna and then perform the second fft"

    Thank you,

    Angie

  • I flipped the axis, but it's still different from what I saw in mmwavestudio. (Right one is an image from mmwavestudio.)

    How can you make this the same as the picture above?

  • Hello,

    I am looking into this and will get back to you soon.

    Thanks,

    Angie

  • Hello,

    Here is a .m file. Please try this script.

    https://e2e.ti.com/cfs-file/__key/communityserver-discussions-components-files/1023/RawAdcDataProc.m

    Thank you,

    Angie

  • Thank you for your sincere response. In the .m file you uploaded, variables such as the number of chirp and the number of frames were adjusted according to the situation. But I still can't see the result I want. In mmwave studio, I can see that the axis is speed and distance, but is this not relevant?

  • Hi Yeon,

    I am sorry but it is out of my scope to explicitly help you with custom code on this forum. I have already stepped a little outside of the scope of e2e by giving you a .m script to try. 

    Thank you,

    Angie