Other Parts Discussed in Thread: AWR1843BOOST,
Dear support Team,
I wonder If there is any way to get the 2D Scatter Plot (X-Y Scatter Plot) instead of the 3D Scatter Plot with the AWR1832AOP in the mmWave Demo Visualizer since I'm only interested in the Azimuth information for now.
I need this plot

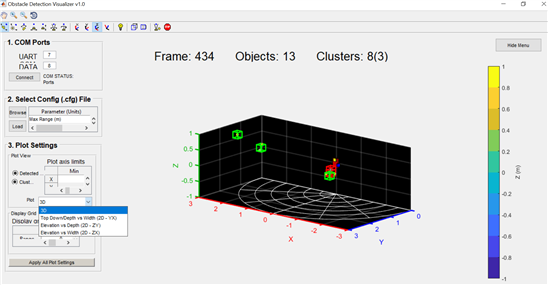
Instead of this one

Thank you in advance.
Kind regards