


Other Parts Discussed in Thread: TPS65400,
Hello,
My customer have designed their system around AWR1843 and the TPS65400 PMIC. They have measured the ripple on the 1.0V RF rail (LDO bypass) while running TI's MRR demo and got the below:
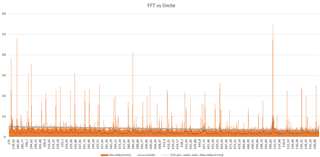
The orange area corresponds to the maximum amplitude measured across the whole measurement period (10's of thousands of measurements). The dotted line is the average over time of this amplitude. The continuous almost horizontal line is the limit set in the device datasheet (Table—Ripple specifications).
Except a significant excursion at around 508 kHz which corresponds to the PMIC switching frequency, the average measurement shows that the ripple is within our specification but for some minor excursions. However the maximum amplitude is above our specification in many points, but only for a small amount of time in average.
My customer ask for our feedback, except for the 508 kHz spike which they will manage in some way. Is it acceptable to consider that the temporary spikes will just translate to a higher noise floor that their signal processing chain has to deal with?
Expert advice will be gratefully accepted!
Best regards,
François.

