This thread has been locked.

If you have a related question, please click the "Ask a related question" button in the top right corner. The newly created question will be automatically linked to this question.

IWR6843ISK: The concave shape of 3D point cloud for single subject indoors

Part Number: IWR6843ISK

Hi,

I collected 3D point cloud data using the mmWave visualizer with one subject executing a T-pose statically indoors (see scenario below). The subject faces the radar sensor placed at 125 cm above the floor at 0 degrees to radar's boresight at all times.
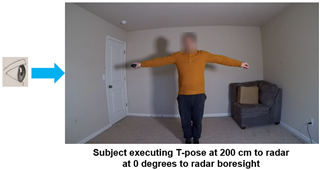
Subject maintained this pose for 90 seconds without moving and during this period the 3D point cloud data has been accumulated. I then created an aggregated 3D plot where I keep all of the detected points visible on the plot. (The 3D point cloud displayed on the mmWave visualizer does not keep the points from one frame to the next, which is the key difference with my approach)

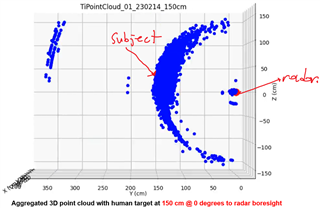
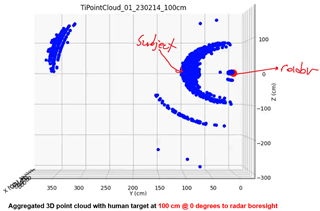
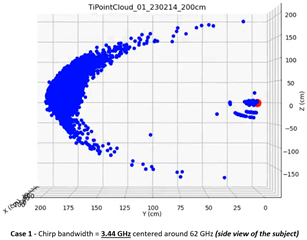
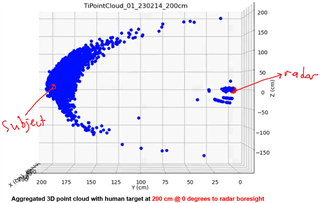
After aggregating the incoming 3D point cloud data, I generated the first 3D plot below. I annotated the radar position and the subject's detected location in red. The displayed 3D point cloud view is a representation of how the scene looks when directly looking at the subject on his right side (as indicated with the eye sketch in the photo above). As expected, I am seeing the subject at 200 cm at 0 degrees to radar boresight. (I can also see intermittent ghost objects in the vicinity of the radar, which is also expected) The density of the point cloud in the vicinity of the subject at 200 cm confirms consistent target reflections are successfully captured. However, an interesting consistency is also observed in the form of a concave shape, which I cannot understand. This shape suggests the radar is detecting the human target almost as a half spherical shape. I repeated the same experiment with the subject at 150 cm and 100 cm. The same concave/crest shape of the aggregated point cloud is still clearly visible in the generated plots (please see the last two plots below)

I would have expected the aggregated point cloud to look almost straight given the straight posture of the subject (and the expected reflections from the head and the legs). Also, a slightly convex shape of the point cloud would have made more sense compared to the concave shape I have obtained.

Can you provide insights into why I am observing this crescent shape consistently in the point clouds I generate? Do I need to apply a transformation to the point cloud for correction at all? How is one supposed to interpret this visual information?

Thank you for your help.

Regards,

Cagri
  • Hi Cagri,

    Allow me to look into this and get back to you. 

    Regards,

    Luke

  • Hi Cagri,

    Are you using the Out of the Box Demo for this data collection?

    It looks like something is wrong in the coordinate transformation: the data looks spherical, but it is plotted on a Cartesian system.

    If the data is coming in as cartesian and you are plotting it as is, then there is a mismatch in the demo code which is not performing the correct transformation. If the data you are receiving is spherical, then there may be a mistake in the coordinate transformation on your end.

    Regards,

    Luke 

  • Hi Luke,

    Thank you for looking into this.

    Yes, I am using the OOB Demo for this. I am simply performing a 3D scatter plot using each x, y, z coordinate tuple provided by the hardware at a 5 fps rate. The spherical appearance is a direct result of what the radar hardware is computing and providing at its output. I am not performing any transformations before creating the plot at all. If the range and the angle for each detected target (i.e. each point in the cloud) is correctly computed by the radar, the scatter plot method I am using should be reflecting the response correctly.

    You have mentioned a mismatch in the demo code, which may lead to a wrong transformation. Could you tell me a bit more about how I can ensure the correct demo code is used? I am starting to think this may be related to the problem I am seeing here.

    Regards,

    Cagri

  • Hi Cagri, can you provide me with the configuration file that you are sending to the device?

  • Sure Luke. Please see attached.

    Regards,

    Cagri

    TiPointCloud_01_230214_200cm.cfg

  • Hello Cagri.

    Thank you for pointing out this. If you look at the implementation guide at the link below (it is for another demo but also applies here) that summarizes the angle-of-arrival estimation (Section 6.1.1), you will see that there is a lambda/d parameter in the steering vector phase components (d is the antenna separation). 

    https://dev.ti.com/tirex/explore/node?a=1AslXXD__1.00.00.26&node=A__AKE9yB4dmaGBeIUYsUEhOg__radar_toolbox__1AslXXD__1.00.00.26

    In the OOB demo algorithm, lambda/d is always assumed to be 0.5. Although d is fixed, the lambda can change with the chirp configuration. Hence, when lambda/d diverges from 0.5, we can see these artifacts, especially at higher angles.

    Some other TI demos updates the steering vectors with the dynamically computed lambda values, but the OOB demo assumes that your chirp ramp is always created around the center frequency.

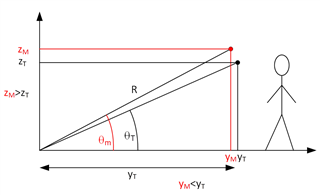
    If the measured angle appears greater than the actual value (due to this phase error), then you see the point with higher z coordinate and smaller y coordinate as depicted below (Acknowledgement for the figure: Slobodan Jovanovic)

    Note that due to the wide-BW nature of FMCW radars, we typically use the center frequency of the FMCW signal model to compute the lambda. When the chirp BW becomes wider, we always expect such artifacts in the point cloud (but should be lower after taking care of this lambda/d parameter).

    To summarize, you can either update the OOB code to to recalculate the lambda/d value based on your configuration, or you should create a chirp configuration to keep the lambda/d close to 0.5.

    I hope this answers your question.

    Regards.

    Muhammet   

  • Hi Luke,

    I can understand the issue you are referring to here and it makes sense. (I will need to look at the code and digest the technical details you have shared)

    One thing that puzzles me is this spherical structure is visible only at the elevation angles and not the azimuth angles based on the data I collected. In other words, if you look at the same plots in birds eye view, you do not observe a spherical artifact (due to the lambda/d ratio you mention) along the azimuth angles. I would have expected to see the same spherical artifact along that direction too if it was due to a lambda/d ratio issue.

    Do you have any thoughts on why the artifact distinctly exists only along the elevation axis?

    Regards,

    Cagri

    P.S. I can share the plots in the birds eye view for the above, if you would like further details on what I am talking about.

  • Hi Cagri,

    Again, I would point you to the document Muhammet linked above: https://dev.ti.com/tirex/explore/node?a=1AslXXD__1.00.00.26&node=A__AKE9yB4dmaGBeIUYsUEhOg__radar_toolbox__1AslXXD__1.00.00.26

    Specifically look at 6.1.1 and all of its subsections, which details the mathematics behind the steering vector design, ultimately a part of the capon beam forming algorithm employed in this demo. Due to the antenna pattern of the ISK, which is not symmetrical in azimuth and elevation, the artifact is much more pronounced in the elevation axis.

    Regards,

    Luke

  • Hi Luke & Muhammet,

    I will review the documentation you have recommended. That is very helpful, thank you.

    In the meantime, I have been thinking about the following you have mentioned earlier:

    " the OOB demo assumes that your chirp ramp is always created around the center frequency."

    "Note that due to the wide-BW nature of FMCW radars, we typically use the center frequency of the FMCW signal model to compute the lambda. When the chirp BW becomes wider, we always expect such artifacts in the point cloud (but should be lower after taking care of this lambda/d parameter)."

    In order to understand what my existing configuration (called TiPointCloud_01_230214_200cm.cfg I shared earlier) looked like in the context of the information you have provided, I performed the following quick calculations:

    The bandwidth the radar is using can be calculated as follows:

     (Eq 1) - Bandwidth (BW) = (Number of ADC samples per chirp) x Chirp slope / (ADC sampling rate) 

    In order to calculate the above bandwidth, I extracted the required parameters from my configuration file, which are as follows:

    Number of ADC samples per chirp = 192

    Chirp slope = 70 MHz/usec

    ADC sampling rate = 3907 ksps

    Plugging the above values into Eq 1 gives BW = 3.439979524 GHz

    Also, the starting frequency is defined as 60 GHz in my configuration file, which means the full band of operation is within the [60 GHz , 63.439979524 GHz]. The center frequency reference you mentioned above is 62 GHz as I understand, which means my bandwidth swings ~2 GHz on either side of the center frequency. This wide swing is what is causing the artifacts at the moment.

    Therefore, if I use say an alternative bandwidth of say 1 GHz in my chirp configuration (at the expense of increasing my distance resolution), this would reduce the swing around the center frequency (i.e. 62 GHz) to 500 MHz. Therefore, lambda/d = 0.5 assumption would be more closely met thereby reducing the concave artifacts significantly.

    Is my understanding and line of thinking above correct? If so, I will devise a new experiment to confirm the validity of my approach.

    Thank you so much for your support.

    Regards,
    Cagri

  • Hi Cagri,

    Your line of thinking is correct. You are following the second course of action in Muhammet's advice: "...you should create a chirp configuration to keep the lambda/d close to 0.5.". 

    Let me know the results of your experiment! We should see the tendency toward concavity disappear.

    Regards,

    Luke

  • Hi Luke,

    Thank you for confirming my approach.

    I performed an additional experiment for the same T-pose scenario (in my first message) at 200 cm distance with 0 degrees to radar boresight. This new experiment involved a new configuration file (see attached) with 700 MHz chirp bandwidth (as opposed to the 3.44 GHz in the first experiment).

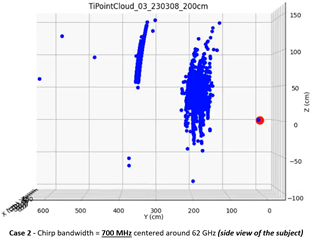
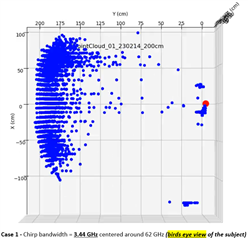
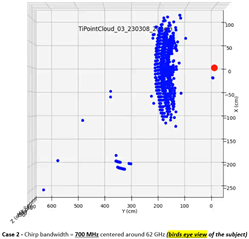
    I have attached the results on the point cloud as below. For convenience, I also included the results from the first experiment. The first two plots are side views of the subject to show the concavity along the (more pronounced) elevation direction. The bottom two plots show exactly the same data but this time from birds eye view (i.e., the top two plots are flipped 90 degrees along the axis perpendicular to your screen) This new view shows the concavity level along the azimuth axis.

    As you have explained before, the significant reduction in concaveness of the point cloud is clearly there (both in the elevation and the azimuth axes). Therefore, reducing the chirp bandwidth definitely helps minimize this artifact.


    I also read the section 6.1.1 and its subsections as per your suggestion. This was useful in terms of gaining insights into the Capon beamforming operation and how it is related to the concaveness issue I have been observing.

    You (and Muhammet) have mentioned that the concaveness was due to the (lambda/d) term in the beamforming equations. However, term “d” is the antenna separation and is fixed (i.e., it is lambda/2) Therefore, lambda/d term is a constant and will not change with the chirp bandwidth.

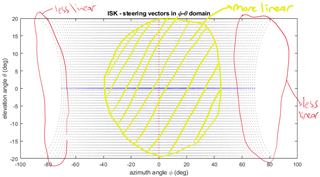
    Upon a closer analysis of the equations and Figure 20 in particular, it seems to me that the reduction of concavity seems to be related to the increase in range resolution rather than the (lambda/d) term. In Figure 20, it is clear that along the azimuth direction (which spans a far larger FoV compared to the elevation direction) as the angles increase, the spacing between beamforming elements (i.e. the blue dots) increases, which causes a non-linearity). The same applies in the elevation direction (i.e. the red dots), however, the increased spacing is not as discernible because the FoV is much narrower than the azimuth. As I understand, this non-linearity is a direct result of the product of two cosine terms in the azimuth direction (see first row in Eq. 2 – page 29) and one sine term in the elevation direction (see third term in Eq. 2 again). The interesting thing is the gray points (in Figure 20) are generated on the fly by multiplying the azimuth and the elevation beamforming elements, which increases the non-linearity even more since two cosine and one sine terms are multiplied to achieve this. Hence, the concavity I have been observing in my first experiment. In the second experiment, when I reduce the bandwidth, the range resolution also drops, making fewer points with strong reflections detectable that seem to bundle towards the center of the human torso (i.e. the target), where the FoV is narrow since the target is at 0 degrees boresight to the radar. As points in the narrower FoV get detected, these become subjected to less non-linearity (as represented by the center points in Figure 20 – I also highlighted that region below for clarity)

    Basically, a chirp bandwidth selection that allows the detection of reflection points closer to the red ellipse regions below will cause severe concavity artifacts, while choosing a bandwidth that allows the majority of detected reflection points to fall within the yellow circle will result in far less concavity of the point cloud. Though the concavity can be reduced through a careful selection of the chirp bandwidth, it cannot be entirely eliminated, which also makes sense.

    Please let me know if my insights on the concavity are correct. Please also let me know if there is anything I might be missing here.

    Regards…


    TiPointCloud_04_230308_200cm.cfg

  • Hi Cagri, 

    Give me a little bit here to verify your work, I will be getting back to you soon. 

    Regards,

    Luke

  • Hello Cagri.

    Thank you for diving into this and for the detailed explanation you made. Thank you also for the analysis to confirm the affect of BW to the point cloud.

    Your conclusion is absolutely right. One thing I want to make it clear is your wording at:

    You (and Muhammet) have mentioned that the concaveness was due to the (lambda/d) term in the beamforming equations. However, term “d” is the antenna separation and is fixed (i.e., it is lambda/2) Therefore, lambda/d term is a constant and will not change with the chirp bandwidth.

    Yes, d is fixed, but lambda can potentially change with the chirp config (with changing start frequency, ADC start time, number of samples, slope, etc.). If you keep the center frequency the same in your updated config, you are right, the lambda/d should be the same.

    The non-linearity in the angular domain is due to the efficient processing approach in angle estimation. FFT works in a uniform axis. Although the phase change across antennas is uniformly spaced, the relation between the phase and angle is non-uniform. FFT is basically estimating the phase change, not the angle directly, So, to translate the data from phase to angle needs this non-linear conversion. But, this should not be the main cause of this concave shape, since all the conversions are handled properly. We will internally double check to ensure there is no bug/issue in the implementation.

    As I mentioned (also you confirmed), we have a wideband signal, but we compute the steering vectors based on a single frequency (i.e., lambda). Therefore, reducing the BW will reduce the gap between the assumption and the actual response, hence will reduce the artifacts you observed. The tradeoff will be the reduced range resolution. Other near-field algorithms can also be used here to improve the imaging accuracy, but the tradeoff will be the computational complexity. An example paper is at:

    ieeexplore.ieee.org/.../stamp.jsp

    Regards.

    Muhammet

  • Hi Muhammet,

    Thank you for verifying my comments.I also acknowledge your note on how lambda changes when the configuration of radar is shifted to another band. That makes perfect sense.

    By the way, how can I follow up the result of the internal evaluation you have mentioned? Will you be updating this thread or do I need to follow another location? Your guidance on that will be greatly appreciated.

    Thank you for sharing the paper on SAR. It does sound like an interesting research but as you have mentioned, there are other hardware and set up complexities one has to trade off to be able to use it. The image resolutions presented there are pretty impressive though.

    Regards,

    Cagri

  • Hi Cagri, 

    I will let you know in this thread when we've concluded our internal check on the implementation.

    Regards,

    Luke