Other Parts Discussed in Thread: IWR6843, IWR6843AOP
Hi Team,
We are seeking your help regarding our customer's inquiry below.
I'm making a program that receives data using iwr6843aopevm in C++ and I don't know much about radar sensors or electronics.
Documents referred to for program development are based on 'Understanding_UART_Data_Output_Format.html' and mmWave demo visualizer web program help.
FRAME and TLVs were received through UART, and the payloads of TLVs are to be expressed with each chart of the visualizer provided by TI.
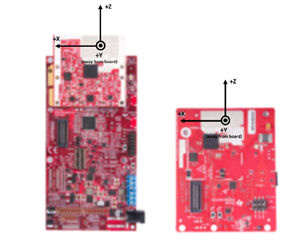
1. TLV type1 Detected Points: I wonder how the coordinate system for object location is matched with the real sensor.
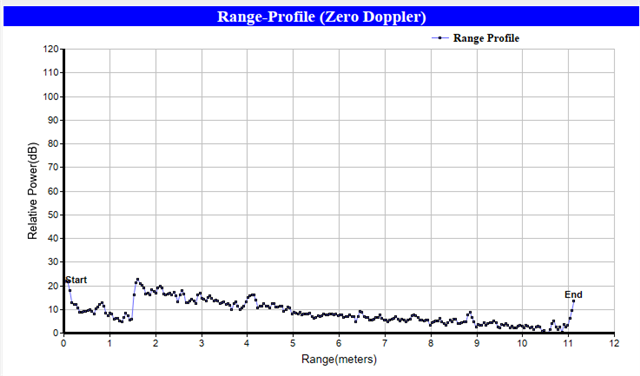
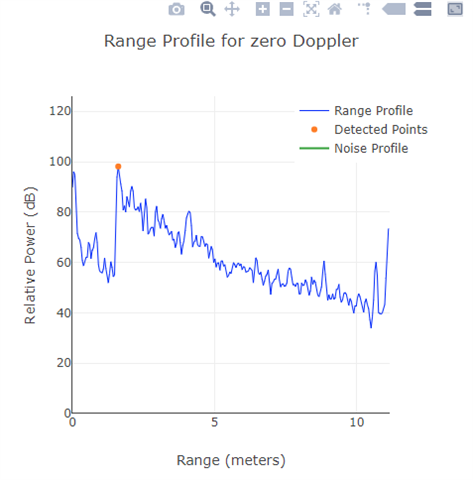
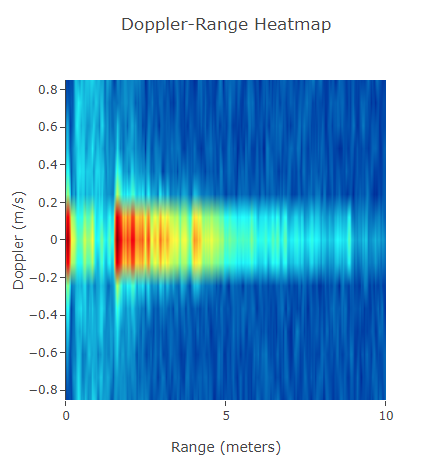
2. TLV type2 Range Profile: I have received the range-profile and converted Q9 arrays to real-number. Compared to what is shown on the visualizer chart, the waveform is similar but the value is small. Q9What kind of calculation should be done after format conversion?
And I wonder how the range profile is expressed from the actual sensor.
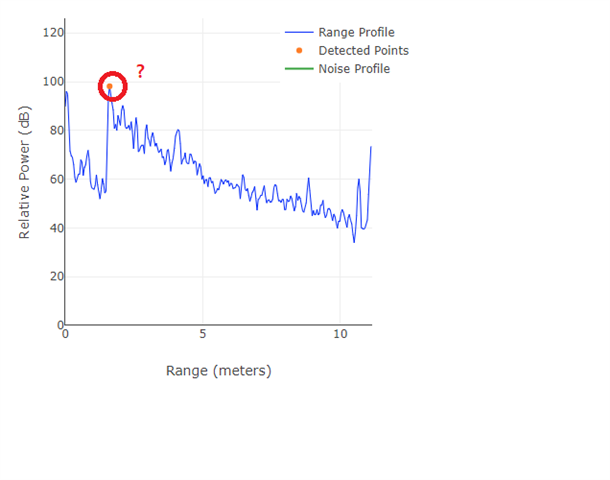
3. How to express detected-points on the visualizer's range-profile chart? And which TLV include that information and need to calculate?
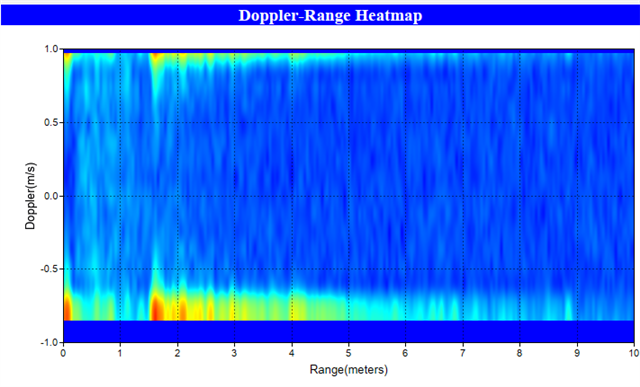
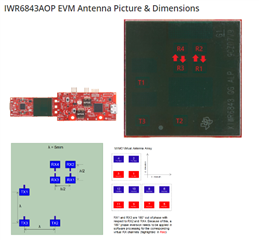
4. TLV type4 Azimuth Static Heatmap: I want to know information about the antenna mentioned that document. I also want to know the information match with the real sensor.
Regards,
Danilo