


Other Parts Discussed in Thread: IWR6843ISK
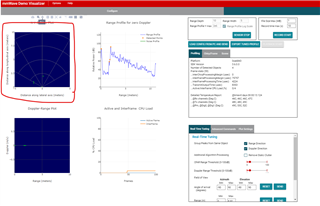
Hello, I am using a setup with DCA1000EVM + IWR6843ISK. I have noticed that in the demo version of the visualizer at https://dev.ti.com/gallery/view/mmwave/mmWave_Demo_Visualizer/ver/3.6.0/, it is possible to observe an angle plot. I need to know how to do this using the raw data generated and saved by the DCA, specifically I have the radarCube object in Matlab, which I obtained by processing the binary file from the DCA using the rawDataReader.m code. In summary, I have a matrix of 128 chirps x 256 samples x 4 receivers, and I need to obtain a matrix of 128 chirps x 256 samples x angle. Where can I find information on how to program this in Matlab?
I would like to make this graph in Matlab and using this matrix I mention before.
Greetings,
Alex
