This thread has been locked.

If you have a related question, please click the "Ask a related question" button in the top right corner. The newly created question will be automatically linked to this question.

AWR6843AOPEVM: Retrieve UART data from sensor using python code

Part Number: AWR6843AOPEVM

Hello TI,

So, my purpose is to get the sensor data in a python code that do other things based on this data.

I tried using the follwoing GIT REPO which is quite easy to understand and is supposed to work, but ...

Here are my different steps : 

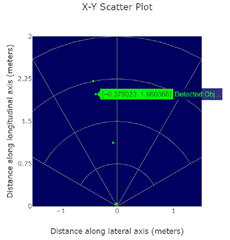
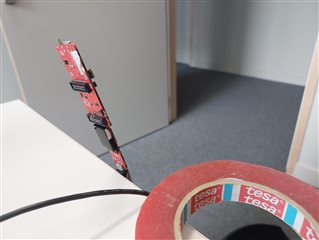
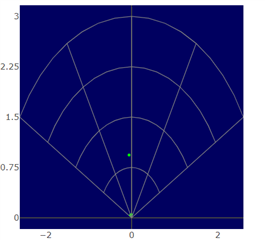
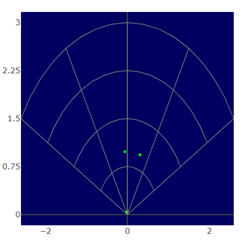
1- Tested the radar by uploading the demo and a config file through the mmWave visualizer, saw the plots, PERFECT.

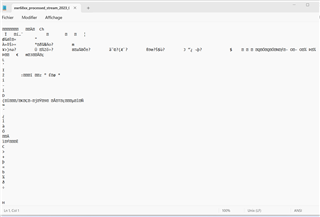
2- I quit the mmWave Visualizer and go check data on a serial print monitor, I get some confusing HEX data where I can still see my magic word, data is printed continuously, I don't decode it.

3- I try to launch the given python code to read my data, I take off the Gui part + the config file sending part (Because it doesn't seem to work, I do this part manually through the mmWave visualizer).

Here is what my troubleshooting of the read function gave : 

◊ The code works just fine till line 204. This means that the magic word is OK

◊ In that line, the problem is with the TLV_TYPE which is never equal to 1 as given in the MMWDEMO_UART_MSG_DETECTED_POINTS : 

When I print the value of TLV_TYPE calculated in line 198, I always get weird and different values.

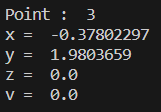
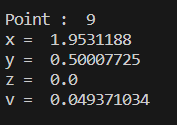
◊ Last thing, if I force my TLV_TYPE to 1 to get some data objects, the detected object is empty and gives nothing.

Could you please help me either with the available code with the right modifications (to get the right TLV type value because I think that the received data is not being used correctly in that part).

Or any ready to use code to retrieve the detected points of the radar, because I need those data for other processing matters.

Thanks and regards,

Lilia.

  • Update : I partly solved the problem by enabling this section which was commented : (lines 193-195)

    # UNCOMMENT IN CASE OF SDK 2
            subFrameNumber = np.matmul(byteBuffer[idX:idX+4],word)
            idX += 4
    However, now that I am getting data, the values are all wrong.
    Any help would be greatly appreciated TI community.
    Thanks.
  • Hi Lilia,

    The repo you've linked appears to be a community developed program. This is not supported by TI. Unfortunately, we aren't able to support this.

    Best Regards,

    Kevin

  • Hello Kevin. I didn't know that, thanks for the reply.

    Isn't there any TI developped code that could allow me to retrieve the sensor's data ? (preferably python). If my understanding is correct, the mmWave Visualizer is retrieving data from the sensor to output the result, any clues on how that is done ? I'd appreciate to see code snippets if that is possible.

    I really need to get the range and velocity to process the rest of my system. 

    Thanks and regards,

    Lilia

  • Hello again Kevin,

    I have a few questions in the continuity of the radar data recovery unrelated to the code. Please enlighten me.

    If I use the detected points TLV (as done in the OOB demo), I get an {x,y,z,velocity} data format : 

    1- Is it right to calculate the range of  the detected object with sqrt[x^2+y^2+z^2] ? (since different ways are used in the Range profile TLV)

    2- In the mmWave Visualizer version I use, there is always only a 2D scatter plot :

    2.1- I'd like to visualize a 3D plot (I read about it in different threads but don't know how to get it). How can I have that ?

    2.2- Could you please explain how are the 2D points retrieved ? Is it through a simple projection of the 3D point in the x-y plan ? is this calculation included in the demo code or in the visualizer side ? (This question is justified in 3)

    3- I was able to retrieve and decode the sensor's detected points data through another external code : read radar data python sdk3 (I know this is out of TI's support). But there is something I'd like to know about the detected points TLV.

    When testing in the mmWave Visualizer, I get for example the (-0.37,1.98) point as seen : 

    When I use the code the data is in agreement with the 2D scatter plot X-Y (see related point retreived) :

    I also use dynamic objects to check the velocity changes (which guarantees the good recovery of the data) :

    The weird thing is that the z parameter is always NULL. As if the radar is sending the detected points TLV with a 2D {x,y} and z=0, instead of a 3D {x,y,z} point, as seen in the 2D scatter plot of the visualizer.

    So please, without taking into account the code itself, I want to understand why my radar is sending a 2D data instead of 3D, can this be related to the use of the visualizer ? or is there something to change in the demo code so that the radar also gives the z value.

    Hoping to get answers for my request.

    Thanks again,

    Lilia.

  • Hi Lilia,

    Could you let us know the specific demo and specific visualizer you are using? We have several and I want to make sure we have that info to provide the right support.

    Thanks,

    Clinton

  • Hi Lilia,

    I wanted to go ahead and point you to some resources that should help with your request. Please take a look at our Industrial visualizer (User's Guide linked below). Once you download the Radar Toolbox, you can find the visualizer code located in the directory listed below along with a couple of files you may be interested in based on your questions. Please let us know if you have any follow up.

    Industrial Visualizer UG:

    https://dev.ti.com/tirex/content/radar_toolbox_1_10_00_13/tools/visualizers/Industrial_Visualizer/docs/mmWave_Industrial_Visualizer_User_Guide.html

    Location in Radar Toolbox:

    <install path>\radar_toolbox_1_10_00_13\tools\visualizers\Industrial_Visualizer

    Python parsing files:

    parseTLVs.py

    parseFrame.py

    Thanks,

    Clinton

  • Hello Clinton,

    Thanks for the reply. I am using the following : 

    Demo : available in C:\ti\mmwave_sdk_03_06_00_00-LTS\packages\ti\demo\xwr68xx 

    mmWave Visualizer : Corresponding to sdk 3.6 version

    I thank you for the suggestions regarding the parsing file, however as said before my code is working and getting the same X-Y scatter plot data and right velocity, which mans the data retreiving process is correct.

    I hope to know if this data format has anything to do with the radar side (config or code), I will be waiting for any guidance from you.

    Thanks a lot !

    Lilia.

  • Hey Lilia,

    If you still would like help, could you clarify what data format you are referencing?

    As an aside, if you would like to verify your range data, the Industrial Visualizer allows the user to save Cartesian and range data directly from the GUI as a .dat file. Under the Plots tab, there is a content box in the top-right corner that contains a button to start sensor recording and fields for adjusting recording time and max file size. The calculation you posted earlier should yield the same result as the data exported from the recording if you would like to verify the accuracy of your current tool.

    Let me know if you have any other questions.

    Regards,

    Kristien

  • Hello Kristien,

    Excuse my delayed answer. I will split it in 3 parts : 

    1) First of all, the .dat file generated is completely incomprehensible (see image bellow).

    2) For the time being my problem is still not solved, for example for the obstacle on the image which is at a 10cm distance from the radar, I get the following point on the mmWave Visualizer : (0.3384624 , 0.9246166).

    I made sure it is the right point by identifying the detected points before and after adding the object.

    If I calculate the range of this object, I get around 0.98m which is absolutely wrong.

    I have tested many other objects at different positions and the result is always incoherent. 

    3) When using the mentionned code to retreive this data, I get the exact same values as the mmWave Visualizer which means that : 

    * The code side can be assumed correct and the troubleshooting is in the radar side.

    * The z axis is never taken into account even if the object is not in the X-Y plan.

    PS : thank you for your answer in the other thread, effectively it was a matter of endianness and I was able to find the correct structure of the data.

    Hoping to get answers.

    Thanks,

    Lilia.

  • Hey Lilia,

    The .dat file is encoded and cannot be read by a text reader. It would have to be imported back into a JavaScript application using the correct stream decoder to be read properly. For now, I would recommend ignoring my previous recommendation to use the exported data, as it would likely make things more complicated, and it seems that you are retrieving accurate data points. I apologize for making that suggestion. 

    As for the incorrect detected point positions, it appears that the antennas are not directed towards the object of interest. For more information on the axes for the antenna, see Section 4.5 xWR6843AOPEVM Antenna of "60GHz mmWave Sensor EVMs" linked below. Figures 4.7 and 4.8 - shown below - should help you orient the antennas properly. 

    https://www.ti.com/lit/pdf/swru546 

    The lack of z-axis data is likely a result of the configuration used in the demo which may be telling the device to exclude z-axis measurements - though this shouldn't be the case. Could you attach a text file with the console output and save the config you're using and attach that as well? I might be able to determine why the z-axis measurements are missing by parsing through the config file at the very least. 

    Regards,

    Kristien

  • Hello Kristien,

    First, thank you for keeping up with my request.

    I will look at the antennas direction you attached and will be back if I have any questions. Regarding the asked documents, you can find attached the config I am using (I changed the angles to -90/90 for both elevation and azimuth when trying the previous example).

    For the output, do you mean the HEX format output or the one where I show my x,y,z,velocity points ? I can give both please confirm only.

    Thanks and regards,

    Lilia.

     6843AOPconfig10Hz.cfg

  • Hey Lilia,

    It appears that the bit mask for the transmit antennas was set to only enable the two azimuth antennas (0x5) under channelCfg for the second parameter. This should be changed to 7 to enable all three transmit antennas including the elevation antenna which will measure the z-axis points. For more information on the configuration files, you can find it in section 3.4 of the MMWAVE SDK User Guide. This can be found by navigating to the following directory:

    C:\ti\mmwave_sdk_03_06_00_00-LTS\docs\mmwave_sdk_user_guide

    If you would like to test to make sure all three transmit antennas are working, select an antenna configuration with three transmit antennas for xWR68xxAOP platform in the mmWave Demo Visualizer and check to make sure 3D data is being received in the plots tab. You can also take a look at the profile_2d.cfg and profile_3d.cfg files stored in C:\ti\mmwave_sdk_03_06_00_00-LTS\packages\ti\demo\xwr68xx\mmw\profiles to better understand the general configuration process used in 2D and 3D applications - though I would recommend looking over the configuration commands in the user guide beforehand.

    Let me know if there are any other issues.

    Regards,

    Kristien

  • Hello Kristien,

    I am finally retrieving z data, I'd like to thank you for your assistance.

    Your answer resolved the problem.

    Thanks and regards,

    Lilia