Other Parts Discussed in Thread: IWR1443
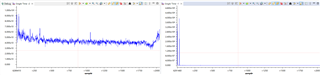
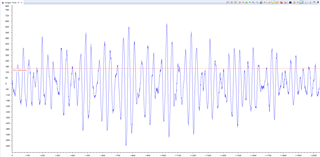
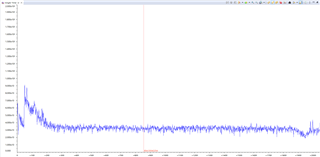
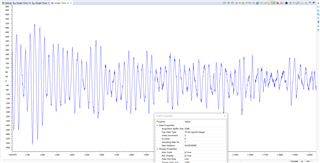
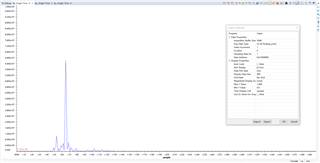
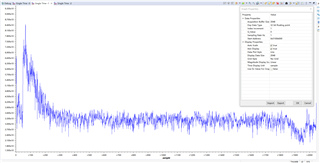
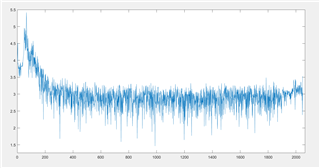
As shown in the figure below, the FFT amplitude of the 2048 point echo data is on the right, and the corresponding log amplitude is on the left; From the left figure, it can be seen that the noise level has significantly increased at the end of 2048. What is the reason for this phenomenon?
Thank you.