This thread has been locked.

If you have a related question, please click the "Ask a related question" button in the top right corner. The newly created question will be automatically linked to this question.

IWR6843ISK: z-coordinates for detected points are always 0.0

Part Number: IWR6843ISK

Hi,

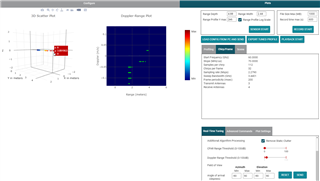
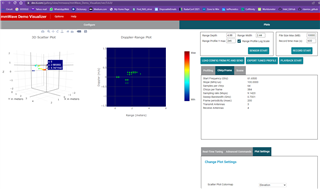
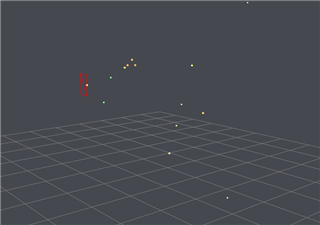
I have collected data indoors from a few static human poses using the point cloud extraction using the mmWave Demo Visualizer platform. I captured this data from different distances to the radar (between 2 meters to 3 meters).

When I decoded the TLV packets in the *.dat file  (including the x, y, z coordinates, Doppler shift as well as snr and noise), I noticed that the z value for each detected point is always reported as 0.0. The x and y coordinates are within my expectations so I know the decoding process is correct.

I have attached the configuration file I have used for initializing the platform in case there is an issue with it. I have also attached a sample *.dat file that was collected using that configuration file.

If you can shed light onto what I may be missing here that will be very helpful.

Regards...

pos_E_rep_1.cfg

pos_E_rep_1.dat  

  • Hey Cagri,

    Looking at your channelCfg line in your config file, it seems like you are not utilizing all of your tx antennas. If you put 7 in txChannelEn field in the channelCfg line (and add another chirpCfg line respectively), does that enable z value data to come off the sensor?

    Regards,
    Luke

  • Hi Luke,

    I see what you are saying. I think there was a mismatch between what I was seeing on the mmWave visualizer configuration screen and the *cfg file that was being actively used.

    I have attached the corrections you have suggested to the new *.cfg. If this looks good to you, I will go ahead and test it.

    Thanks for your swift response to this.

    Regards,
    Cagri

    3TX4RX_active_config.cfg

  • Hi Luke,

    I used the *.cfg file with 3 TX and 4 RX antennas active and captured the attached data on mmWave visualizer.

    Even though I get the data displayed as 3D scatter plot as expected, The z-component of all the detected points in the cloud are always zero (as I indicated with the mouse pointer in the attached screenshot)

    I am not sure if there is another configuration parameter I need to configure differently, Please advise.

    Thank you for your help.

    Regards...

  • Hello Cagri,

    I am going to see if I can replicate your findings using your cfg file.

    Regards,
    Luke

  • Thanks Luke. That will be very helpful.

    One more thing (which I assume you have noticed as well), the color coding I have used in terms of elevation can be clearly seen in the points the 3D scatter plot (above). However, all the points are mapped to z = 0 coordinate for some reason. I have decoded the TLVs for a sample capture and confirmed that the z coordinates are indeed mapped to 0.0. So the elevation information (indicated by changing colors) seems to be lost somewhere for some reason.

    Regards...

  • Hi Luke,

    I also tried one more thing a few minutes ago, which I think will help you shed light onto what the issue is.

    I remember a while back I did manage to capture non-zero z-axis data using mmWave Visualizer, which used a narrower bandwidth (i.e., 700 MHz) centered at 62 GHz. I am attaching the *.cfg file I used for that old data capture.

    The corresponding 3D scatter plot for one sample capture is include below. As you can see the color coded elevation information for each captured point is accompanied by non-zero z coordinates as one would expect.

    Therefore, it seems the z coordinates in the case of full bandwidth point captures seem to be the culprit. This is just a guess based on what the data is showing and there may be another root cause for this of course. I wanted to share this with the hope that it will help with your investigation.

    Regards...

    RadarConfig_700MHz_BW_centered@62GHz.cfg

  • Okay, thank you for providing more context, I will use that config as well. 

    I am very curious to see what the cause is here. I will be getting back to you within a few hours. 

    Thanks Cagri,
    Luke 

  • Hi Cagri,

    So, I would recommend that you use the mmWave Industrial Visualizer from the newest version of our Radar Toolbox at <RADAR_TOOLBOX_INSTALL_DIR>\tools\visualizers\Industrial_Visualizer. I do not think the issue lies within the configurations but in the visualizer. I find that I am able to get z information all of the configurations you've sent, not just the last one. 

    You can save the UART data from this visualizer as well.

    Regards,
    Luke

  • Hi Luke,

    Thanks for looking into this. That's great news.

    It sounds like using the Industrial visualizer moving forward will make sense.

    Will I need to change any firmware on my antenna board to be able to use that or is the industrial visualizer fully backward compatible with version 3.5+ SDKs?

    Regards...

  • Hi Cagri, 

    I would recommend upgrading to 3.6 if possible. This is an LTS SDK version so you would not have to worry about changing firmware again. However, I believe it should work with 3.5, though I am not certain. 

    Regards,
    Luke

  • Sounds good. I will try 3.5 first and upgrade to 3.6 if necessary. I will be in touch in case of any issues.

    Thanks for the guidance Luke.

    Regards,,,