Other Parts Discussed in Thread: MMWAVEICBOOST, , UNIFLASH
Hello,
I am experiencing an issue with the IWR6843ISK Radar (reference PROC073D(001_IWR)/ES2.0 (RTM silicon)) and the MMWAVEICBOOST Evaluation Module (reference PROC074B), using SDK version 3.6.
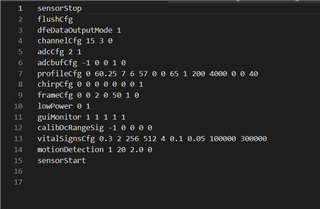
The issue occurs after sending the configuration file to the radar and starting the test. After about ten identical tests with a reset each time, the radar sends an error message (see attached photo). To resolve this issue, it is sometimes necessary to reset the radar each time or to flash the radar with the uniflash software. However, despite these attempts, the same issue occurs sometimes, requiring a hardware reset by discharging certain capacitors on the evaluation module. One important thing we would like to know is why the radar bug occurs after 10 tests where nothing happens on the GUI (no signals).

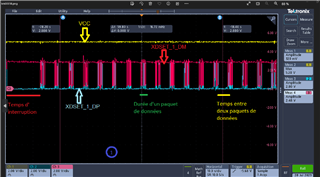
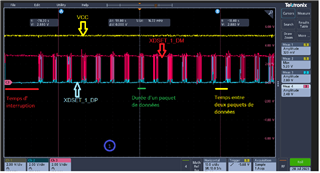
To better understand this issue, we have visualized the various signals from the UART (VCC, XDSET_1_DM, and XDSET_1_DP) on an oscilloscope using a micro-USB. When using the GUI with the VitalSignsRadar_Demo software, we noticed that during normal operation (without bugs), the various signals appear correctly on the oscilloscope with a time between two data packets evaluated at 4 seconds and the time of a data packet evaluated at 2 seconds, with an interruption time of 12.7 seconds where there is no data. We would like to know why we have this interruption time and what is causing it.
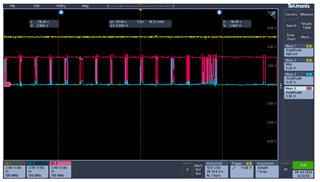
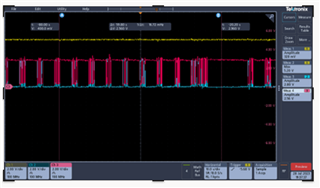
During a test where the bug occurred, we noticed that despite the bug, data packets were still visible on the oscilloscope until the signals disappeared completely. However, on the GUI, there were no more signals. We would like to know why we still have data packets on the oscilloscope but not on the GUI.
We also noticed that if we press "stop" on the GUI, we still have data traffic on the oscilloscope and that we have to completely exit the GUI by closing it to stop the data traffic.
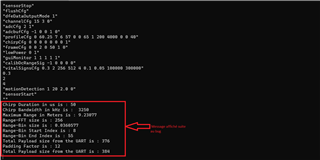
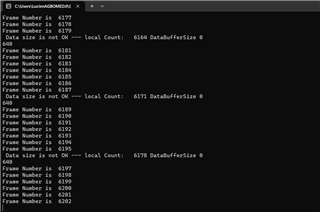
Finally, during a test, a buffer saturation message appeared on the command prompt. We would like to know what could cause this buffer saturation (latency, data processing errors, etc.).
We hope this information helps you understand the issue we are experiencing. We remain available for any further information.
Best regards, Lucien