Other Parts Discussed in Thread: AWR2944
Hi TI experts,
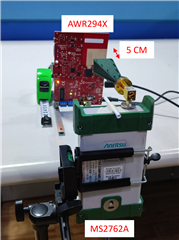
I am measuring the radiated Tx power from a single Tx antenna array "AWR2944EVM + mmWave Demo Visualizer". Since only TDM is available for Demo Visualizer, I could ensure any instant power that I measure is from a single antenna. According to the datasheet of AWR2944 and the user guide of the AWR2944 Evaluation Module, I've learned the typical Tx power is 13.5dBm on AWR2944, and the peak gain of an antenna is 13dBi.
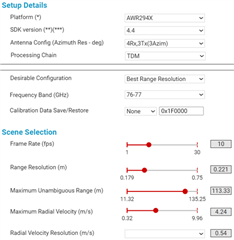
Question 1: I would like to know if the radiated Tx power is 13.5dBm + 13dBi = 26.5dBm when my configurations on the Demo Visualizer are like the two pictures below,
Config1:
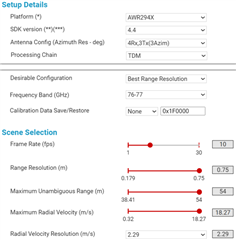
Config2:
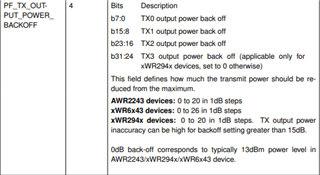
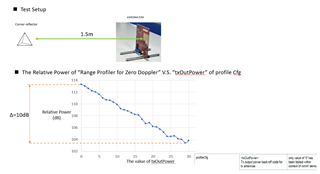
Question 2: According to the "MMWAVE SDK User Guide", one command in profileCFG is as below picture. I would like to know if I am not allowed to change another value to change TX power when I am running over the mmWave Demo Visualizer. Per my experiments, the radiated Tx power didn't have any change when modifying this value.
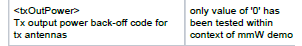
Question 3: Is there any way to enable the parameter to change Tx power?
Thanks,
Sean