


I'm having trouble deciding how to go about this; I would like advice from someone who has an understanding of development with the IWR1642BOOST
I'm trying to use the radar sensor to map the slope of a surface from a stationary position. I've collected data using the detected objects demo with the radar sensor oriented so the plot is a set of positions along the slope. Here's what a plot looks like:
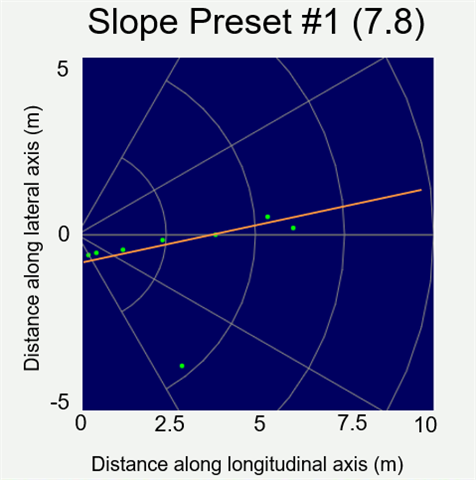
I've added the red line and turned the plot on its side to illustrate what I'm trying to do.
I'm having trouble deciding the direction this project should take. I want to increase the number of detected objects along the slope, so I can get a higher fidelity understanding of the incline. I'm not sure how to do this, so I looked into modifying the code of the demo, but I've had no success.
I'm also having trouble reading in the .dat's generated from the demo correctly. My plots do not match the detected objects plots in the demo, when I parse the detected object portion of the packet. I'm using a modified version of the code at this link: (I'm using SDK 3.6, so I suspect I have an incompatibility issue, as others say the code works for them)
This code has what I need to do in it, but I'm having trouble breaking out the functionality that I need to read in the data:
https://dev.ti.com/gallery/view/mmwave/mmWave_Demo_Visualizer/ver/3.6.0/app/mmWave.js
Ultimately, is my approach of using the object detection demo to find points along a slope to approximate its incline reasonable? Is there other code/firmware that I can use to make the task easier? And how can I parse the .dat files properly.
