


Hello Expert,
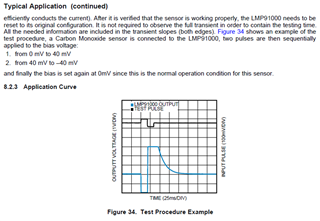
When we look at the data sheet, there seems to be information about self-diagnosis as shown below.
We believe it is about CA testing.
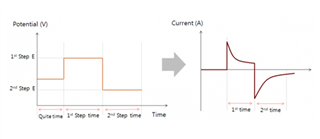
We tested using +30mV and -30mV as the BIAS voltage, and the voltage in response is similar to the graph in the datasheet.
But the maximum and minimum values are shown as output.
I know that CA test usually come out in the form of a graph like below.
I would like to know how to judge sensor performance based on the graph from the data sheet, and I would like to know if there is a solution that allows me to use self-diagnosis in my project.

Best Regards,
Michael
