


Hi, TI support。
I have a question about how to debug sbl in the SDK(ti\mmwave_mcuplus_sdk_04_04_01_02\mcu_plus_sdk_awr294x_09_00_00_15).
As shown in the below, when I make a CPU reset, then the address 0x10279E60 is shown in the list, and this address belong to the Application(The SBL image is belong to the address region 0x1020 0000-1022 0000).
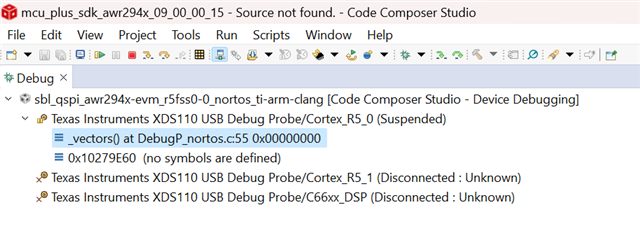
Then when I load the SBL .out, the debug probe will be running status, just like below:

It seems that the when debug of SBL alway go to the application address rather than itself address after load the .out file.
So does the debug configuration in the SDK need modify?
Regards,
Sonia Yang
