This thread has been locked.

If you have a related question, please click the "Ask a related question" button in the top right corner. The newly created question will be automatically linked to this question.

IWRL6432BOOST: IWRL6432BOOST

Part Number: IWRL6432BOOST
Other Parts Discussed in Thread: IWRL6432

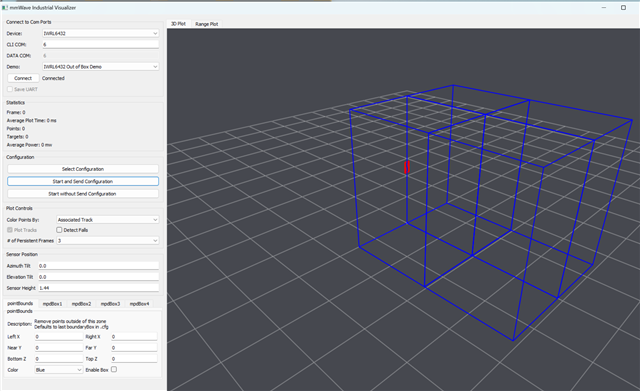
I have started the Presence and Motion Detection Demo.

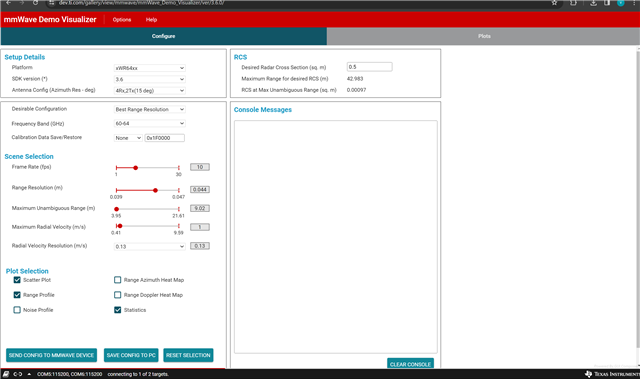
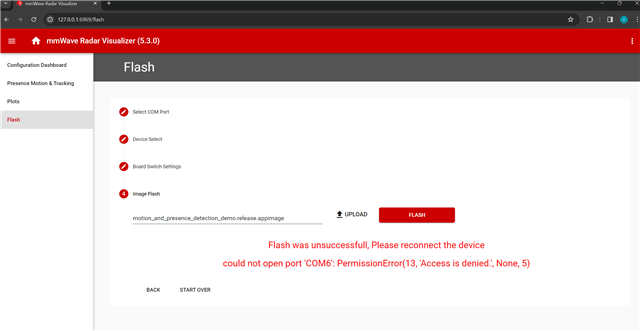
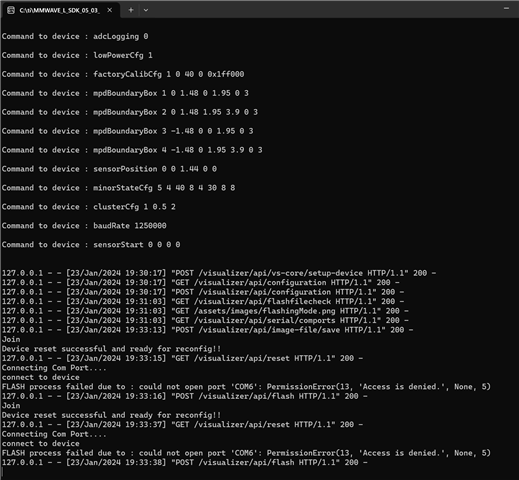
Did the flash QSPI with image from low power visualizer 5.3.0.0 following the instructions.

However, I am getting 0 frame counter, 0 average power.

Can you advise what am I missing?

Did confirm all switches are correct.

  • Hi, 

    After you have loaded the image to flash you must change the switch settings again to set the device to functional mode. Has this been done? It may be helpful if you could upload a picture of your board to confirm the correct switch settings. 

    Also, please let me know which configuration is being used to run the demo. Are you using a default configuration? Or uploading a customized .cfg file? 

    Best Regards,

    Josh

  • Hi, Josh,

    I did change the switches and I was using the default configuration. I did try all four options, none of them worked.

  • Hi,

    Thanks for the response and sharing a picture of your board. You switch settings are indeed correct for functional mode.

    After pressing the Send Selected Config button in the visualizer, do you see any error message show up in the console? Also can you please let me know the path of the .appimage file that you have loaded to flash? 

    Best Regards,

    Josh

  • There is no error message. Attached is the log.

    The path of the image file is 

    C:\ti\MMWAVE_L_SDK_05_03_00_02\examples\mmw_demo\motion_and_presence_detection\prebuilt_binaries\xwrL64xx

    file name is motion_and_presence_detection_demo.release.appimage


    Searching for free port ...
    Free port found at 6969
    Starting WebServer...
     * Serving Flask app 'visualizer' (lazy loading)
     * Environment: production
       WARNING: This is a development server. Do not use it in a production deployment.
       Use a production WSGI server instead.
     * Debug mode: off
    WARNING: This is a development server. Do not use it in a production deployment. Use a production WSGI server instead.
     * Running on http://127.0.0.1:6969
    Press CTRL+C to quit
    Starting UI ...
    127.0.0.1 - - [19/Jan/2024 19:17:07] "GET / HTTP/1.1" 200 -
    127.0.0.1 - - [19/Jan/2024 19:17:07] "GET /runtime.js HTTP/1.1" 200 -
    127.0.0.1 - - [19/Jan/2024 19:17:07] "GET /polyfills.js HTTP/1.1" 200 -
    127.0.0.1 - - [19/Jan/2024 19:17:07] "GET /styles.js HTTP/1.1" 200 -
    127.0.0.1 - - [19/Jan/2024 19:17:07] "GET /scripts.js HTTP/1.1" 200 -
    127.0.0.1 - - [19/Jan/2024 19:17:07] "GET /vendor.js HTTP/1.1" 200 -
    127.0.0.1 - - [19/Jan/2024 19:17:07] "GET /main.js HTTP/1.1" 200 -
    127.0.0.1 - - [19/Jan/2024 19:17:07] "GET /roboto-latin-400.woff2 HTTP/1.1" 200 -
    server listening on 127.0.0.1:6974
    WebSocket Server Started
    127.0.0.1 - - [19/Jan/2024 19:17:07] "GET /assets/images/Flowchart.png HTTP/1.1" 200 -
    127.0.0.1 - - [19/Jan/2024 19:17:07] "GET /MaterialIcons-Regular.woff2 HTTP/1.1" 200 -
    127.0.0.1 - - [19/Jan/2024 19:17:07] "GET /roboto-latin-700.woff2 HTTP/1.1" 200 -
    127.0.0.1 - - [19/Jan/2024 19:17:07] "GET /roboto-latin-500.woff2 HTTP/1.1" 200 -
    127.0.0.1 - - [19/Jan/2024 19:17:07] "GET /visualizer/api/version HTTP/1.1" 200 -
    connection open
    127.0.0.1 - - [19/Jan/2024 19:17:34] "GET /visualizer/api/configuration HTTP/1.1" 200 -
    127.0.0.1 - - [19/Jan/2024 19:17:34] "GET /visualizer/api/serial/comports HTTP/1.1" 200 -
    127.0.0.1 - - [19/Jan/2024 19:17:34] "POST /visualizer/api/configuration HTTP/1.1" 200 -
    127.0.0.1 - - [19/Jan/2024 19:17:34] "GET /assets/images/mdi.svg HTTP/1.1" 200 -
    127.0.0.1 - - [19/Jan/2024 19:17:34] "POST /visualizer/api/configuration HTTP/1.1" 200 -
    127.0.0.1 - - [19/Jan/2024 19:17:34] "POST /visualizer/api/configuration HTTP/1.1" 200 -
    127.0.0.1 - - [19/Jan/2024 19:17:34] "POST /visualizer/api/configuration HTTP/1.1" 200 -
    127.0.0.1 - - [19/Jan/2024 19:17:34] "GET /assets/images/functionalMode.png HTTP/1.1" 200 -
    127.0.0.1 - - [19/Jan/2024 19:17:35] "POST /visualizer/api/configuration HTTP/1.1" 200 -
    127.0.0.1 - - [19/Jan/2024 19:18:09] "POST /visualizer/api/configuration HTTP/1.1" 200 -
    127.0.0.1 - - [19/Jan/2024 19:18:33] "GET /visualizer/api/serial/comports HTTP/1.1" 200 -
    127.0.0.1 - - [19/Jan/2024 19:18:37] "POST /visualizer/api/configuration HTTP/1.1" 200 -
    Join
    Device reset successful and ready for reconfig!!
    127.0.0.1 - - [19/Jan/2024 19:18:45] "GET /visualizer/api/reset HTTP/1.1" 200 -
    None
    a
    C
    Successfully connected to COM6 ...
    True
    Start parsing messages ...
    Visualizer Core Started
    Requesting for versions
    Command to device : version
    
    Command to device : sensorStop 0
    
    Command to device : channelCfg 7 3 0
    
    Command to device : chirpComnCfg 18 0 0 128 4 30 0
    
    Command to device : chirpTimingCfg 6 28 0 90 59.75
    
    Command to device : frameCfg 8 0 400 1 250 0
    
    Command to device : guiMonitor 2 2 0 0 0 1 1 0 0 0 0
    
    Command to device : sigProcChainCfg 64 8 2 0 4 4 0 .5
    
    Command to device : cfarCfg 2 4 3 2 0 12.0 0 0.5 0 1 1 1
    
    Command to device : aoaFovCfg -60 60 -40 40
    
    Command to device : rangeSelCfg 0.1 4.0
    
    Command to device : clutterRemoval 1
    
    Command to device : compRangeBiasAndRxChanPhase 0.0 1.00000 0.00000 -1.00000 0.00000 1.00000 0.00000 -1.00000 0.00000 1.00000 0.00000 -1.00000 0.00000
    
    Command to device : adcDataSource 0 adc_data_0001_CtestAdc6Ant.bin
    
    Command to device : adcLogging 0
    
    Command to device : lowPowerCfg 1
    
    Command to device : factoryCalibCfg 1 0 40 0 0x1ff000
    
    Command to device : mpdBoundaryBox 1 0 1.48 0 1.95 0 3
    
    Command to device : mpdBoundaryBox 2 0 1.48 1.95 3.9 0 3
    
    Command to device : mpdBoundaryBox 3 -1.48 0 0 1.95 0 3
    
    Command to device : mpdBoundaryBox 4 -1.48 0 1.95 3.9 0 3
    
    Command to device : sensorPosition 0 0 1.44 0 0
    
    Command to device : minorStateCfg 5 4 40 8 4 30 8 8
    
    Command to device : clusterCfg 1 0.5 2
    
    Command to device : baudRate 1250000
    
    Command to device : sensorStart 0 0 0 0
    
    sensorStop 0
    
    Done
    
    mmwDemo:/>channelCfg 7 3 0
    
    Done
    
    mmwDemo:/>chirpComnCfg 18 0 0 128 4 30 0
    
    Done
    
    mmwDemo:/>chirpTimingCfg 6 28 0 90 59.75
    
    Done
    
    mmwDemo:/>frameCfg 8 0 400 1 250 0
    
    Done
    
    mmwDemo:/>guiMonitor 2 2 0 0 0 1 1 0 0 0 0
    
    Done
    
    mmwDemo:/>sigProcChainCfg 64 8 2 0 4 4 0 .5
    
    Done
    
    mmwDemo:/>cfarCfg 2 4 3 2 0 12.0 0 0.5 0 1 1 1
    
    Done
    
    mmwDemo:/>aoaFovCfg -60 60 -40 40
    
    Done
    
    mmwDemo:/>rangeSelCfg 0.1 4.0
    
    Done
    
    mmwDemo:/>clutterRemoval 1
    
    Done
    
    mmwDemo:/>compRangeBiasAndRxChanPhase 0.0 1.00000 0.00000 -1.00000 0.00000 1.00000 0.00000 -1.00000 0.00000 1.00000 0.00000 -1.00000 0.00000
    
    Done
    
    mmwDemo:/>adcDataSource 0 adc_data_0001_CtestAdc6Ant.bin
    
    Done
    
    mmwDemo:/>adcLogging 0
    
    Done
    
    mmwDemo:/>lowPowerCfg 1
    
    Done
    
    mmwDemo:/>factoryCalibCfg 1 0 40 0 0x1ff000
    
    Done
    
    mmwDemo:/>mpdBoundaryBox 1 0 1.48 0 1.95 0 3
    
    'mpdBoundaryBox' is not recognized as a CLI command
    mmwDemo:/>mpdBoundaryBox 2 0 1.48 1.95 3.9 0 3
    
    'mpdBoundaryBox' is not recognized as a CLI command
    mmwDemo:/>mpdBoundaryBox 3 -1.48 0 0 1.95 0 3
    
    'mpdBoundaryBox' is not recognized as a CLI command
    mmwDemo:/>mpdBoundaryBox 4 -1.48 0 1.95 3.9 0 3
    
    'mpdBoundaryBox' is not recognized as a CLI command
    mmwDemo:/>sensorPosition 0 0 1.44 0 0
    
    Done
    
    mmwDemo:/>minorStateCfg 5 4 40 8 4 30 8 8
    
    'minorStateCfg' is not recognized as a CLI command
    mmwDemo:/>clusterCfg 1 0.5 2
    
    'clusterCfg' is not recognized as a CLI command
    mmwDemo:/>baudRate 1250000
    
    JsensorStart 0 0 0 0
    
    
    127.0.0.1 - - [19/Jan/2024 19:18:54] "POST /visualizer/api/vs-core/setup-device HTTP/1.1" 200 -
    127.0.0.1 - - [19/Jan/2024 19:18:54] "GET /visualizer/api/configuration HTTP/1.1" 200 -
    127.0.0.1 - - [19/Jan/2024 19:18:54] "POST /visualizer/api/configuration HTTP/1.1" 200 -
    

  • Hi Victor, 

    Thanks for sharing the console log. I'm sorry but one more question from my side. Do you know the silicon revision of the device on your EVM? For example is it ES1.0? If you are unsure we can tell based on the markings on the package itself. From the image you shared, the markings are not clear. 

    Best Regards,

    Josh

  • Hope this is the package you want to see.

  • Hello, 

    That is not the correct device. I apologize I should have been more specific. It should be the smaller chip on the front of the EVM where the antenna traces are leading to. 

    Regards,

    Josh

  • Hello,

    Thank you. It seems your device is ES1.0 so you are using the correct FW for your device. One more point of clarification, have any hardware modifications been made to the EVM? 

    From the information you have shared it is hard to pinpoint what the exact issue could be. From what I can tell you are taking all of the correct steps. One thing I could think to try next would be to try using a different visualizer/GUI as it's possible that the EVM is working fine and the SDK visualizer is having issues with your PC. There is another visualizer that you can use to run this demo which is included with the Radar Toolbox. You will need to download the Radar Toolbox to your PC and follow the steps in this User Guide. See the section titled "Using the Radar Toolbox Industrial Visualizer". 

    Best Regards,

    Josh

  • Thanks.

    This is from Radar Toolbox, I am not getting the response either.

    It is possible that my board is not working?

    It is a board that I have just received, can you give me a replacement?

  • I am trying to reflash. This time, I am getting access denied error.

  • Hi, 

    1. The image you shared in the post above is actually not the visualizer I was referring to. That visualizer does not support the IWRL6432 so the response you are seeing is expected. Please refer to the Presence and Motion Detection User's Guide. This guide gives steps for running the demo with either the SDK Visualizer (which you have tried and are seeing issues with) as well as the Industrial Visualizer (this is a python based application located at <RADAR_TOOLBOX_INSTALL>/tools/visualizers/Industrial_Visualizer). You can also double check to make sure that every step in this guide is followed to ensure you are not missing any required procedure. 

    2. The access denied error that you are seeing when trying to reflash the appimage is usually observed when some other program running on the PC is still holding the com ports open (for example: teraterm, or some other visualizer application). Please ensure these programs are shut down/disconnected before attempting to reflash the board. 

    Best Regards,

    Josh

  • Thanks.

    Which configuration file should I choose?

    <RADAR_TOOLBOX_INSTALL_DIR>\src\ti\examples\<ExampleName>\chirp_configs

    There are many Examples in the folder.

    Inside /Industrial_Visualizer, there is no chirp_configs file.

  • Hello, 

    The user guide states that one of the configurations at <RADAR_TOOLBOX_INSTALL_DIR>\source\ti\examples\Presence_and_Motion_Detection\chirp_configs\ can be used. Alternatively, the configurations at C:\ti\MMWAVE_L_SDK_05_03_00_02\examples\mmw_demo\motion_and_presence_detection\profiles\xwrL64xx-evm can be used.

    Best Regards,

    Josh

  • Hi,

    Which config file should I use? There are 6 config files.

    I tried motionDetect.fcg and PresenceDetect.cfg. Both did not show anything.

    I am getting No data error from the board. 

    ERROR: No data detected on COM Port, read timed out
    Be sure that the device is in the proper mode, and that the cfg you are sending is valid
    ERROR: No data detected on COM Port, read timed out
    Be sure that the device is in the proper mode, and that the cfg you are sending is valid
    ERROR: No data detected on COM Port, read timed out
    Be sure that the device is in the proper mode, and that the cfg you are sending is valid
    ERROR: No data detected on COM Port, read timed out
    Be sure that the device is in the proper mode, and that the cfg you are sending is valid
    ERROR: No data detected on COM Port, read timed out
    Be sure that the device is in the proper mode, and that the cfg you are sending is valid
    ERROR: No data detected on COM Port, read timed out
    Be sure that the device is in the proper mode, and that the cfg you are sending is valid

    Python is 32 bit
    Python version: sys.version_info(major=3, minor=7, micro=4, releaselevel='final', serial=0)
    CLI COM Port found: COM6
    Data COM Port found: COM5
    Device Changed to: IWRL6432
    Demo Changed to: IWRL6432 Out of Box Demo
    Parser type: IWRL6432 Out of Box Demo
    Connected (one port)
    mpdZoneType: mpdBoundaryBox
    mpdZoneType: mpdBoundaryBox
    mpdZoneType: mpdBoundaryBox
    2
    b''
    b''
    b''
    b''
    b''
    b''
    b''
    b''
    b''
    b''
    b''
    b''
    b''
    b''
    b''
    b''
    b''
    b''

  • Update

    This time, I think I have missed the switch.

    I see white dots on the screen

  • The white dots are detected points in the point cloud which are being plotted in a 3D space. This means that at least your board is working as you have sent the configuration and received output data. Have you retried again with the SDK visualizer now that you managed to reflash the demo appimage? If so, do you still see the frame counter stuck a 0 and plots not updating?

    Best Regards,

    Josh

  • Now the high performance motion detect works. The low power presence detect is not working.

  • Hello,

    The low power presence detect is not working.

    By "not working" do you mean that it is showing the same behavior (i.e. sends the configuration but frame counter stuck at 0 and plots do not update)? Also, are you sending the low power presence detect configuration after already running a different configuration? If so, can you try closing down the visualizer completely and resetting the board before sending a new configuration?

    Best Regards,

    Josh

  • This time, I disconnected the USB cable and reconned. Then started the visualizer under Low_power_visualizer_5.3.0.0.

    Attached is the log. It does not show average power and 0 frame.

    I can then select High performance motion detect and it show me the dots.

    Searching for free port ...
    Free port found at 6969
    Starting WebServer...
    * Serving Flask app 'visualizer' (lazy loading)
    * Environment: production
    WARNING: This is a development server. Do not use it in a production deployment.
    Use a production WSGI server instead.
    * Debug mode: off
    WARNING: This is a development server. Do not use it in a production deployment. Use a production WSGI server instead.
    * Running on http://127.0.0.1:6969
    Press CTRL+C to quit
    Starting UI ...
    127.0.0.1 - - [25/Jan/2024 20:51:03] "GET / HTTP/1.1" 200 -
    127.0.0.1 - - [25/Jan/2024 20:51:03] "GET /runtime.js HTTP/1.1" 200 -
    127.0.0.1 - - [25/Jan/2024 20:51:03] "GET /polyfills.js HTTP/1.1" 200 -
    127.0.0.1 - - [25/Jan/2024 20:51:03] "GET /styles.js HTTP/1.1" 200 -
    127.0.0.1 - - [25/Jan/2024 20:51:03] "GET /scripts.js HTTP/1.1" 200 -
    127.0.0.1 - - [25/Jan/2024 20:51:03] "GET /vendor.js HTTP/1.1" 200 -
    127.0.0.1 - - [25/Jan/2024 20:51:03] "GET /main.js HTTP/1.1" 200 -
    127.0.0.1 - - [25/Jan/2024 20:51:03] "GET /roboto-latin-400.woff2 HTTP/1.1" 200 -
    server listening on 127.0.0.1:6974
    WebSocket Server Started
    127.0.0.1 - - [25/Jan/2024 20:51:03] "GET /assets/images/Flowchart.png HTTP/1.1" 200 -
    127.0.0.1 - - [25/Jan/2024 20:51:03] "GET /MaterialIcons-Regular.woff2 HTTP/1.1" 200 -
    127.0.0.1 - - [25/Jan/2024 20:51:03] "GET /roboto-latin-500.woff2 HTTP/1.1" 200 -
    127.0.0.1 - - [25/Jan/2024 20:51:03] "GET /roboto-latin-700.woff2 HTTP/1.1" 200 -
    127.0.0.1 - - [25/Jan/2024 20:51:03] "GET /visualizer/api/version HTTP/1.1" 200 -
    connection open
    127.0.0.1 - - [25/Jan/2024 20:51:09] "GET /visualizer/api/configuration HTTP/1.1" 200 -
    127.0.0.1 - - [25/Jan/2024 20:51:09] "GET /visualizer/api/serial/comports HTTP/1.1" 200 -
    127.0.0.1 - - [25/Jan/2024 20:51:09] "POST /visualizer/api/configuration HTTP/1.1" 200 -
    127.0.0.1 - - [25/Jan/2024 20:51:09] "POST /visualizer/api/configuration HTTP/1.1" 200 -
    127.0.0.1 - - [25/Jan/2024 20:51:09] "POST /visualizer/api/configuration HTTP/1.1" 200 -
    127.0.0.1 - - [25/Jan/2024 20:51:09] "POST /visualizer/api/configuration HTTP/1.1" 200 -
    127.0.0.1 - - [25/Jan/2024 20:51:09] "GET /assets/images/mdi.svg HTTP/1.1" 200 -
    127.0.0.1 - - [25/Jan/2024 20:51:09] "GET /assets/images/functionalMode.png HTTP/1.1" 200 -
    127.0.0.1 - - [25/Jan/2024 20:51:09] "POST /visualizer/api/configuration HTTP/1.1" 200 -
    127.0.0.1 - - [25/Jan/2024 20:51:15] "POST /visualizer/api/configuration HTTP/1.1" 200 -
    Join
    Device reset successful and ready for reconfig!!
    127.0.0.1 - - [25/Jan/2024 20:51:18] "GET /visualizer/api/reset HTTP/1.1" 200 -
    None
    a
    C
    Successfully connected to COM6 ...
    True
    Start parsing messages ...
    Visualizer Core Started
    Requesting for versions
    Command to device : version

    Command to device : sensorStop 0

    Command to device : channelCfg 7 3 0

    Command to device : chirpComnCfg 18 0 0 128 4 30 0

    Command to device : chirpTimingCfg 6 28 0 90 59.75

    Command to device : frameCfg 8 0 400 1 250 0

    Command to device : guiMonitor 2 2 0 0 0 1 1 0 0 0 0

    Command to device : sigProcChainCfg 64 8 2 0 4 4 0 .5

    Command to device : cfarCfg 2 4 3 2 0 12.0 0 0.5 0 1 1 1

    Command to device : aoaFovCfg -60 60 -40 40

    Command to device : rangeSelCfg 0.1 4.0

    Command to device : clutterRemoval 1

    Command to device : compRangeBiasAndRxChanPhase 0.0 1.00000 0.00000 -1.00000 0.00000 1.00000 0.00000 -1.00000 0.00000 1.00000 0.00000 -1.00000 0.00000

    Command to device : adcDataSource 0 adc_data_0001_CtestAdc6Ant.bin

    Command to device : adcLogging 0

    Command to device : lowPowerCfg 1

    Command to device : factoryCalibCfg 1 0 40 0 0x1ff000

    Command to device : mpdBoundaryBox 1 0 1.48 0 1.95 0 3

    Command to device : mpdBoundaryBox 2 0 1.48 1.95 3.9 0 3

    Command to device : mpdBoundaryBox 3 -1.48 0 0 1.95 0 3

    Command to device : mpdBoundaryBox 4 -1.48 0 1.95 3.9 0 3

    Command to device : sensorPosition 0 0 1.44 0 0

    Command to device : minorStateCfg 5 4 40 8 4 30 8 8

    Command to device : clusterCfg 1 0.5 2

    Command to device : baudRate 1250000

    Command to device : sensorStart 0 0 0 0


    127.0.0.1 - - [25/Jan/2024 20:51:26] "POST /visualizer/api/vs-core/setup-device HTTP/1.1" 200 -
    127.0.0.1 - - [25/Jan/2024 20:51:26] "GET /visualizer/api/configuration HTTP/1.1" 200 -
    127.0.0.1 - - [25/Jan/2024 20:51:27] "POST /visualizer/api/configuration HTTP/1.1" 200 -

  • Hi,

    This is strange behavior. If one of the default configuration files is working for you then there should be no HW issue so the other default configurations should also be working. Please allow me to attempt to replicate this behavior on my end and get back to you. Thank you for your patience. 

    Best Regards,

    Josh

  • Hi Victor, 

    I'm very sorry for the delay here. I have not been able to replicate the issues you are seeing with the default configurations. Are you still having this issue? If so, we may need to look at another way to debug the problem. 

    Best Regards,

    Josh