This thread has been locked.

If you have a related question, please click the "Ask a related question" button in the top right corner. The newly created question will be automatically linked to this question.

IWR6843ISK: Relation between Detected Point and distance

Part Number: IWR6843ISK

I am using the mmWave Demo Visualizer to carry out the evaluation.

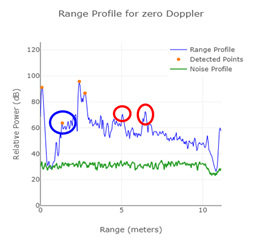
The diagram below shows the graph when the module is placed against a wall.

I understand that if the difference between the Noise Profile and Range Profile peaks is greater than the CFGR threshold, it is plotted as Detected Points, is this correct?

For example, the red circle in the diagram below is not plotted as Detected Points even though its peak is larger than the blue circle.

Why is this, and is it related to the distance as well as the peak value of the Range Profile?

Best Regards,

  • Hello,

    Very good question. CFAR thresholding that is set in the configuration file compares possible detections to the window neighbors of the signal, not actually the pure SNR of the detection. Otherwise it would not really be a peak search, just a blob anywhere that was above the threshold would be considered a detection. In the blue circle you can see its neighbor to the left's power is significantly lower, and then once the power drops again to its right it was enough to be considered a detection. In the red circles, they are close to being peaks with a small drop to both its left and right, and with a lower CFAR threshold they would most definitely be considered a detection.

    Best Regards,

    Pedrhom