This thread has been locked.

If you have a related question, please click the "Ask a related question" button in the top right corner. The newly created question will be automatically linked to this question.

IWR6843ISK: Small obstacle detection lab related questions

Part Number: IWR6843ISK

I am trying to use my iWR6843ISK board to run the small obstacle detection lab. The goal is to get the output data when an object is detected in the occupancy box and use the signal to control another device connected to the same PC through USB. 

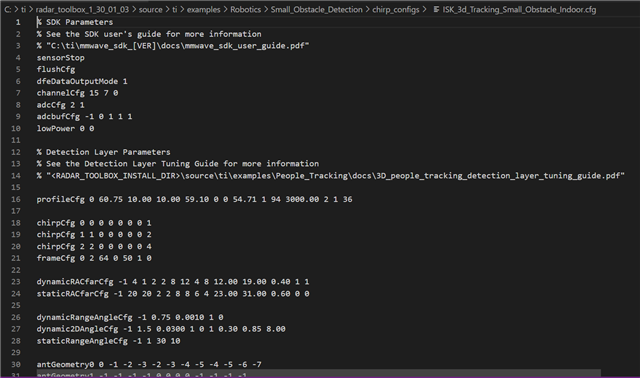
 I first tried to run the example lab in the Robotics library, I burnt the prebuilt_binaries .bin code under mmwave_industrial_toolbox/labs/Robotics/Small_Obstacle_Detection into the iWR6843ISK board, then used the configuration file under Small_Obstacle_Detection/Chirp_configs to see how the board works in visualizer, everything worked very well, I could see the two zones showing in the visualizer window and turned red from green when objects are placed in front of the board, everything works fine. Then, I tried to follow the Small Obstacle Detection User's Guide to modify the source for the demo and visualizer, that's when I encounter problems. I first import and build the project in CCS, it went well, both the DSS and MSS projects were built in the workspace directory. I also successfully burnt the .bin code generated in the MSS project directory to the board, but when I tried to use visualizer to see how the board works, I run into problems, first I don't know which configuration file should I use, I tried to use the same configuration file in the Small_Obstacle_Detection/Chirp_configs directory as I used when I run the demo, but it didn't work, I got this Index out of range error on the terminal window:

Traceback (most recent call last):
File "gui_threads.py", line 40, in run
outputDict = self.parser.readAndParseUart()
File "gui_parser.py", line 74, in readAndParseUart
if (magicByte[0] == magicWord[index]):
IndexError: index out of range
Traceback (most recent call last):

then I tried to use the .cfg files under the newly built project directory in workspace, there is one file called mmw_mss.cfg under workspace/small_obstacle_detection_68xx_mss, and also a file called mmw_mss_per4ft.cfg under workspace/small_obstacle_detection_68xx_mss/Debug/configPkg/package/cfg, I tried to use both cfg file in visualizer, but both didn't work, it's showing "No cfg file selected!" in the terminal window.

Could you help me to move forward? Thanks a lot!

  • Another question I have is if I don't need to modify the original Small Obstacle Detection lab bin file, I just want to be able to get the result 1 or 0 when an object is detected in the occupancy box, is there a way to do it by using the original bin file in the Robotics tool box library? How can I access the result? Right now I can only see the result in visualizer, i.e. the box turn red when an object is detect, but i want to access the 1 or 0 data output and send to another device or app in real time. Thanks!

  • Hello,

    If the prebuilt binary worked with a prebuilt config, and then the project is correctly imported and built in CCS with no changes, there should be changes in the created binary. Are you compiling the project with SDK 3.6 within CCS? As far as accessing the result, I would recommend checking out the Industrial Visualizer's source code. In a nutshell, a UART stream is opened with the running sensor, and based on the predefined types of messages that are programmed to come in from the sensor, we will know exactly what packet is what piece of information. The python visualizer does exactly that in order to visualize different things based on the sensor output. The TLV structure and what the type, length, and value of the occupancy box is can be found in the Understanding UART Data Output Guide.

    Best Regards,

    Pedrhom

  • Hi Pedrhom, the sdk I installed was mmwave_SDK_03_06, should be the correct one, right? I followed all the steps in the Small Obstacle Detection Lab's User Guide to rebuild the small obstable detection project, but I couldn't view the results in visualizer using the bin file generated, I think maybe I used the wrong configuration file, which configuration files should I use in visualizer? When I run the original bin file provided in the small obstacle detection lab (without rebuilding, just load the bin come with industrial toolbox), I could see the results in visualizer busing the configuration file in the lab directory. I tried to use the same configuration file when running the rebuilt bin, it didn't work.

    Another question is how can I see the Visualizer's source code? In the source code I can learn how to access the TLV data transferred back from EVM?

    Thanks!

  • Hello,

    Are you not sending the same configuration file with the CCS built binary versus the prebuilt one? You can open a chirp config file in a text editor of your choice and it should look like this.

    mmw_mss.cfg and other ".cfg" files generated by CCS share the same extension name, but are completely different. The chirp configuration as shown above is essentially a text file. The source code for the visualizer is in the same location as the executable. You can run the visualizer from source and it running the same by doing "python gui_main.py"

    Best Regards,

    Pedrhom

  • Hi Pedrhom, I did the same configuration file with both the prebuilt binary and binary generated after I built the MSS and DSS projects, the configuration file worked with the prebuilt binary and I was able to see results in visualizer, but it didn't work with the binary generated from built MSS project. I only found one cfg file in the chirp_configs directory and it is different from the one you showed in the above reply, I don't know if I need to download and install a different version of industrial toolbox, but this config file worked with the prebuild binary, I think it might be fine.

    Here is what I saw in my chirp_configs directory:

    Only one file called 68xx_ISK.cfg exist in the directory: mmwave_industrial_toolbox_4_12_1/labs/Robotics/Small_Obstacle_Detection/chirp_configs. The cfg file content is:

    sensorStop
    flushCfg
    dfeDataOutputMode 1
    channelCfg 15 7 0
    adcCfg 2 1
    adcbufCfg -1 0 1 1 1
    lowPower 0 0
    profileCfg 0 60 7 3 24 0 0 166 1 256 12500 0 0 158
    chirpCfg 0 0 0 0 0 0 0 1
    chirpCfg 1 1 0 0 0 0 0 4
    chirpCfg 2 2 0 0 0 0 0 2
    frameCfg 0 2 32 0 100 1 0
    guiMonitor -1 1 0 0 0 0 1
    cfarCfg -1 0 2 8 4 3 0 12.0 0
    cfarCfg -1 1 0 4 2 3 1 15.0 0
    multiObjBeamForming -1 1 0.5
    calibDcRangeSig -1 0 -5 8 256
    clutterRemoval -1 0

    compRangeBiasAndRxChanPhase 0.0 1 0 1 0 1 0 1 0 1 0 1 0 1 0 1 0 1 0 1 0 1 0 1 0
    measureRangeBiasAndRxChanPhase 0 1. 0.2

    aoaFovCfg -1 -90 90 -90 90
    cfarFovCfg -1 0 0.25 9.0
    cfarFovCfg -1 1 -20.16 20.16
    extendedMaxVelocity -1 0

    CQRxSatMonitor 0 3 4 63 0
    CQSigImgMonitor 0 127 4
    analogMonitor 0 0
    lvdsStreamCfg -1 0 0 0
    bpmCfg -1 0 0 0
    calibData 0 0 0

    % numZones, pointsEntryThreshold, snrEntryThreshold, frameEntryThreshold, pointsMaintainThreshold, snrMaintainThreshold, pointsExitThreshold, frameExitThreshold
    occStateMach 2 6 8 3 1 5 0 5
    % ZoneNumber minx maxx miny maxy minz maxz
    zoneDef 0 -0.5 0.5 0 0.75 -0.3 0.5
    zoneDef 1 -0.5 0.5 0.75 1.5 -0.3 0.5
    sensorStart

    When I use this config file with prebuild binary, everything works; but with the binary generated from building MSS and DSS projects, I got the following error in the terminal when Start and Send Configuration in Visualizer:

    Traceback (most recent call last):
    File "gui_threads.py", line 40, in run
    outputDict = self.parser.readAndParseUart()
    File "gui_parser.py", line 74, in readAndParseUart
    if (magicByte[0] == magicWord[index]):
    IndexError: index out of range
    Traceback (most recent call last):
    File "gui_threads.py", line 40, in run
    outputDict = self.parser.readAndParseUart()
    File "gui_parser.py", line 74, in readAndParseUart
    if (magicByte[0] == magicWord[index]):
    IndexError: index out of range

    It just keep on going with those errors.

    Also I found the gui_main file in the Visualizer directory and opened it with notepad. I can read all the commands in the file. It is a pretty long file. I wonder if you can point me to the part where Visualizer read the output data from the EVM, i.e. 1 when an object detect in the occupancy box and 0 when no object is detected.

    Thanks a lot!

  • Hello,

    You are using a very old version of the toolbox. Please refer to and download the newest version of the Radar Toolbox.

    https://dev.ti.com/tirex/explore/node?a=1AslXXD__1.30.01.03&node=A__AFBXnwiM2XV37eEtzWKflA__radar_toolbox__1AslXXD__1.30.01.03

    Best Regards,

    Pedrhom

  • Pedrhom, thanks. I've downloaded the Radar Toolbox and will give it a try.

    Also I found the gui_main file in the Visualizer directory and opened it with notepad. I can read all the commands in the file. It is a pretty long file. I wonder if you can point me to the part where Visualizer read the output data from the EVM, i.e. 1 when an object detect in the occupancy box and 0 when no object is detected.

  • Hi Pedrhom, I've tried with the example inside the Radar Toolbox you told me to install. Now both the prebuilt binary and binary generated from building DSS and MSS projects work fine. I was able to use the same configuration file and saw results in Visualizer window. Thanks a lot for your help.

    What I need to do next is to figure out how to read the occupancy result, the 1 or 0 data. I've opened the gui_main file and try to find the related commands, but the file is so large and I don't know what to look for. Could you tell me which commands are related to reading the occupancy results? I need to get the data 1 when an object is in the occupancy box and 0 when no object is in the box. Please tell me how to receive that data. Thanks!

  • Hello.

    You can start with parseTLV.py and work your way backwards. parseTLV has all the actions to take depending on what TLV comes in, with the occupancy box function being parseOccStateMachTLV. The sensor sends a single uint32_t (32 bit integer) for this TLV. The way it needs to be processed is by checking each bit. If the first bit is a 1, then the first defined zone is occupied, if it is 0 then it is unoccupied. If the second bit is a 1, the second defined zone is occupied, and so on. This allows the TLV to support up to 32 defined zones. You can then work your way backwards from parseTLV -> parseFrame -> gui_parser -> gui_threads -> gui_main to see how it gets to that point.

    The below Radar Academy page also covers how the output data is created and formatted on a high level.

    https://dev.ti.com/tirex/explore/node?a=GwxShWe__1.30.00.7&node=A__AUAJwr4zBXhyz-M3VG2cUg__RADAR-ACADEMY__GwxShWe__1.30.00.7&placeholder=true

    Best Regards,

    Pedrhom

  • Hi Pedrhom, thanks for the info. I'll read all the files and try to understand the whole process. I understand the data generated by the EVM is sent to PC through the data COM port, which file you mentioned above has the commands or functions to read or receive data from the data COM port? Is it all in parseTLV.py?

    Also is there a document explaining all the functions such as parseOccStateMachTLV. etc.?

  • Hello,

    You can look for parameters and functions that mention UART as that is the communication protocol. But the actual reading/receiving of the data from COM port is going to be readAndParseUartDoubleCOMPort within gui_parser.  There is no documentation that goes over every function.

    Best Regards,

    Pedrhom