This thread has been locked.

If you have a related question, please click the "Ask a related question" button in the top right corner. The newly created question will be automatically linked to this question.

AWR2243: Analog monitoring result display in Wavestudio

Part Number: AWR2243

Hi,

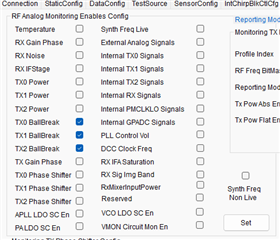
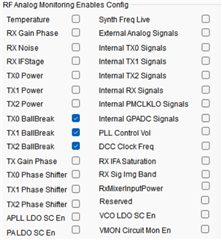
   I'm trying to use WaveStudio to monitor some information. For example, I enabled TX Ballbreak in RF Anglog  Monitoring Enables Config, and set the configuration in TX Ball Break Monitoring, but I can't find anywhere to display the monitoring results. I want to know the typical values of TX reflection coefficient. How and where can I see the monitoring results?
     

  • Hello,

    Below are the steps to enable monitoring.

    1. Select the monitor

    2. Configure the monitor

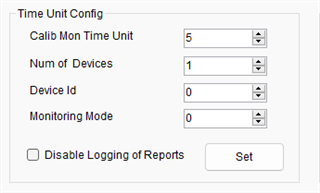
    3. Set the cal mon time unit

    4. Start framing. The monitor will trigger every N number of frames, where N is the value set for cal mon time unit. If you enable multiple monitors it is up to you to make sure you allow enough time for all monitors to happen within one cal mon time unit based on your interframe time and the duration of each monitor.

    The monitor data will be generated in a txt file located at C:\ti\mmwave_studio_03_00_00_14\mmWaveStudio\PostProc\MonitoringReport.txt

    Regards,

    Adrian