This thread has been locked.

If you have a related question, please click the "Ask a related question" button in the top right corner. The newly created question will be automatically linked to this question.

+ MMWAVEICBOOST + DCA1000: Post Processing on raw ADC Data

Part Number: AWR6843AOPEVM

Hi,

I'm trying to develop my own demo visualizer based on the raw Data captured with the DCA1000.
I'm already able to read the raw Data of the Radar which runs the OOB Demo.

The following configurations are used:

xwr68xx_AOP_profile.cfg

{
    "DCA1000Config": {
        "dataLoggingMode": "raw",
        "dataTransferMode": "LVDSCapture",
        "dataCaptureMode": "ethernetStream",
        "lvdsMode": 2,
        "dataFormatMode": 3,
        "packetDelay_us": 10,
        "ethernetConfig": {
            "DCA1000IPAddress": "192.168.33.180",
            "DCA1000ConfigPort": 4096,
            "DCA1000DataPort": 4098
        },
        "ethernetConfigUpdate": {
            "systemIPAddress": "192.168.33.30",
            "DCA1000IPAddress": "192.168.33.180",
            "DCA1000MACAddress": "12.34.56.78.90.12",
            "DCA1000ConfigPort": 4096,
            "DCA1000DataPort": 4098
        },
        "captureConfig": {
            "fileBasePath": "/home/mettmann/Hochschule/Master/masterarbeit/software/data",
            "filePrefix": "datacard_record",
            "maxRecFileSize_MB": 1024,
            "sequenceNumberEnable": 1,
            "captureStopMode": "infinite",
            "bytesToCapture": 1025,
            "durationToCapture_ms": 1000,
            "framesToCapture": 5
        },
        "dataFormatConfig": {
            "MSBToggle": 0,
            "reorderEnable": 1,
            "laneFmtMap": 0,
            "dataPortConfig": [
                {
                    "portIdx": 0,
                    "dataType": "complex"
                },
                {
                    "portIdx": 1,
                    "dataType": "complex"
                },
                {
                    "portIdx": 2,
                    "dataType": "complex"
                },
                {
                    "portIdx": 3,
                    "dataType": "complex"
                },
                {
                    "portIdx": 4,
                    "dataType": "complex"
                }
            ]
        }
    }
}

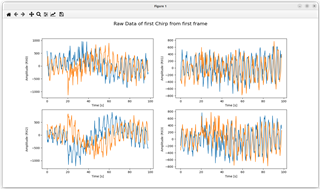
The complex raw Data of one Chirp looks as following. Unfortunately there seems to be an offset of the amplitude between the real and imaginary part of the data.

Where does this offset come from?
  

  • Hi, there:

    I would suggest you to take range FFT and Doppler FFT of your raw data and check where the power comes from.   

    If you have a very clean environment in the Anechoic chamber and setup a corner reflector in a certain distance.  You should see a peak in that distance.  In addition, you will see high signal close to DC which is due to the TX-RX coupling.   

    You can check the spectrum of your received ADC data and see whether it matches with your testing environment.  It is really hard to predict how ADC data should looks like. 

    Best,

    Zigang

  • Thank you for your reply!


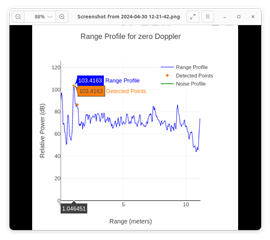
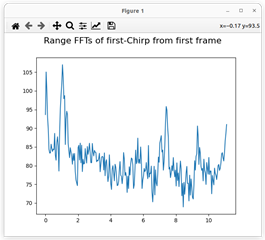
    So I calculated the range FFT and compared the results with the range Profile of the OOB Demo.


    So both range profiles have peaks at 1.04m which is a promising result since I placed a reflector 1.05m away.

    But the magnitudes seem to differ. For my range profile I calculated the sum of the Signal from the 4 RX Antennas and expressed the value in Decibel (20*log10()).

    Are the more processing steps needed to get the same range profile?

  • HI, 

    When you program the chirps, are you enable all 12 virtual antennas or just 4?  Range profile is the sum of all virtual antennas. 

    And the range FFT windowing may not be exactly the same.  Since I do not have access to the source code for display as well.  I can not tell you what exactly is the FFT windowing.   

    These are the two reasons I can think of.  

    Best,

    Zigang

  • Thanks again!

    For the chirp configuration I activated all 4 Rx Antennas. Each Frame consists of 16 loops of the 3 Tx Antennas sending a chirp sequentially.

    I use the following configuration:

    % ***************************************************************
    % Created for SDK ver:03.06
    % Created using Visualizer ver:3.6.0.0
    % Frequency:60
    % Platform:xWR68xx_AOP
    % Scene Classifier:best_range_res
    % Azimuth Resolution(deg):30 + 30
    % Range Resolution(m):0.044
    % Maximum unambiguous Range(m):9.02
    % Maximum Radial Velocity(m/s):1
    % Radial velocity resolution(m/s):0.13
    % Frame Duration(msec):100
    % RF calibration data:None
    % Range Detection Threshold (dB):15
    % Doppler Detection Threshold (dB):15
    % Range Peak Grouping:enabled
    % Doppler Peak Grouping:enabled
    % Static clutter removal:disabled
    % Angle of Arrival FoV: Full FoV
    % Range FoV: Full FoV
    % Doppler FoV: Full FoV
    % ***************************************************************
    sensorStop
    flushCfg
    dfeDataOutputMode 1
    channelCfg 15 7 0
    adcCfg 2 1
    adcbufCfg -1 0 1 1 1
    profileCfg 0 60 359 7 57.14 0 0 70 1 256 5209 0 0 158
    chirpCfg 0 0 0 0 0 0 0 1
    chirpCfg 1 1 0 0 0 0 0 2
    chirpCfg 2 2 0 0 0 0 0 4
    frameCfg 0 2 16 0 100 1 0
    lowPower 0 0
    guiMonitor -1 1 1 0 0 0 1
    cfarCfg -1 0 2 8 4 3 0 15 1
    cfarCfg -1 1 0 4 2 3 1 15 1
    multiObjBeamForming -1 1 0.5
    clutterRemoval -1 0
    calibDcRangeSig -1 0 -5 8 256
    extendedMaxVelocity -1 0
    lvdsStreamCfg -1 0 1 0
    compRangeBiasAndRxChanPhase 0.0 1 0 -1 0 1 0 -1 0 1 0 -1 0 1 0 -1 0 1 0 -1 0 1 0 -1 0
    measureRangeBiasAndRxChanPhase 0 1.5 0.2
    CQRxSatMonitor 0 3 5 121 0
    CQSigImgMonitor 0 127 4
    analogMonitor 0 0
    aoaFovCfg -1 -90 90 -90 90
    cfarFovCfg -1 0 0 8.92
    cfarFovCfg -1 1 -1 1.00
    calibData 0 0 0
    sensorStart


    For my application I am not using a window function. This probably makes a difference.

  • Hi, there:

    Can you check the range profile is per TX/RX antenna in mmwave studio post processing or the non-coherently combined for all 12 antenna?

    And what about your script?

    Best,

    Zigang

  • Hi,
    where can I check how the range profile is calculated?
    I am working on Linux so I am using the CLI interface for data capturing. The range profile I use is from the mmWave Demo Visualizer.

    In my code I calculate the sum of the RX Antennas and not of the virtual Antennas.

    Best,
    Jan

  • HI, Jan:

    You can find the demo users guide in Doxygen documentation below. 

    file:///C:/ti/mmwave_sdk_03_06_00_00-LTS/packages/ti/demo/xwr68xx/mmw/docs/doxygen/html/index.html#tlv2

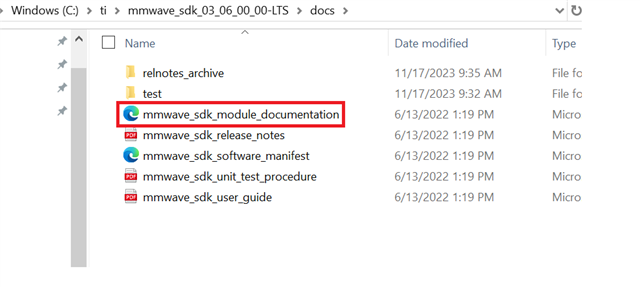
    You can open mmwave_sdk_module_documentation.html in SDK under doc directory and click the right demo to find more details. 

    And you can also import the demo to CCS and search how the range profile is calculated.  You can find the ccs project spec in toolbox release

    C:\ti\radar_toolbox_x_xx_xx_xx\source\ti\examples\Out_Of_Box_Demo\src

    Best,

    Zigang

  • Hi Zigang:
    thanks for the info! I will check the OOD Code for the exact post processing steps.

    I also changed my code that I now calculate the Range-FFT for all virtual antennas. When I am right, the FFT over the virtual Antennas is needed for the calculation of the Doppler-FFT and the angle estimation?

    Best,
    Jan

  • Hi, Jan:

    Yes, use all the virtual antenna will bring you the best performance for both CFAR and angle estimation.

    Best,

    Zigang