Other Parts Discussed in Thread: DCA1000EVM,
Tool/software:
Dear fellow engineers,
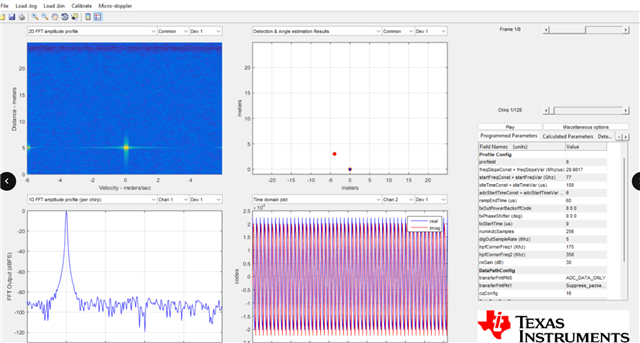
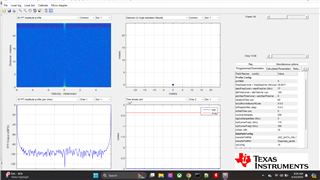
I'm using a Texas Instruments AWR1642BOOST with a DCA1000EVM. No matter where I run the DataCaptureDemo_xWR.lua script, the visualization from mmWave Studio always looks like the attached image (with the same one detection to the left of center in the top right plot). I tried running it in a garage, a open field, a park, in my office, pointing directly at a huge six tone truck. The image always looks the same. The adc_data.bin is slightly different at each capture. But the visualization always looks the same despite very different scenes. So, there are a few possibilities:
(1) I'm misunderstanding the visualization. Maybe I need to take the ADC raw data and process it myself to see the differences?
(2) I'm pointing the sensor the wrong way; in the attached image, I expect the radar to be looking out of my car's trunk and not forwards towards my car's seats?
(3) I have the radar switches or software settings configured improperly somehow?
(4) Texas Instruments sent me defective hardware?
Since there are many possibilities, I figured I'd ask here for guidance. Thanks in advance!
Best, James, III