This thread has been locked.

If you have a related question, please click the "Ask a related question" button in the top right corner. The newly created question will be automatically linked to this question.

IWRL6432: CCS Debug

Part Number: IWRL6432

Tool/software:

Hi TI experts,

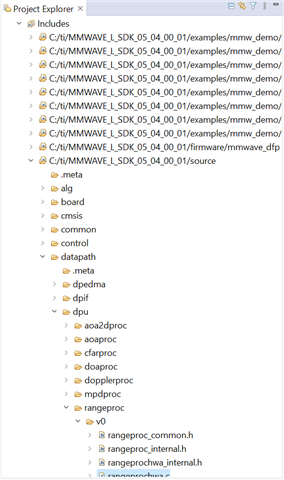
I am using CCS 12.6 and SDK 5.4.0.1, and I have imported the motion_and_presence_detection example into CCS.
I have flashed the empty project and set lowPowerCfg 0 in the .cfg and set gDebugTargetCode to 1 in the code.
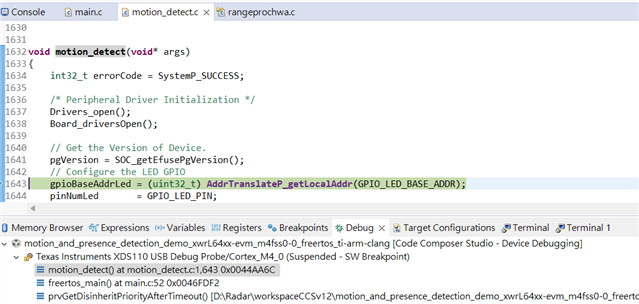
I can set breakpoints and step through the code.

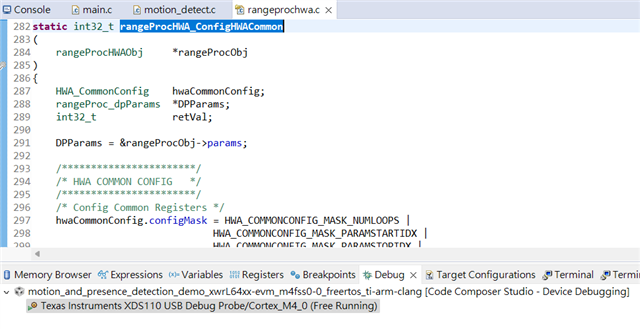
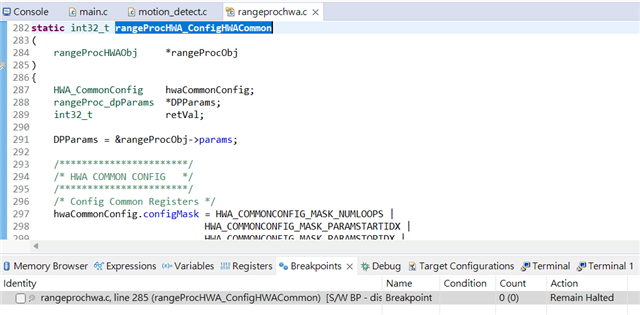
Now I want to view the hwaCommonConfig variable in the rangeProcHWA_ConfigHWACommon() function in the rangeprochwa.c file through the expression window. How can I do that?

Regards,
Daniel

  • Hi Daniel, 

    You should be able to open the rangeprochwa.c file in CCS from the motion_and_presence_detection project in the project explorer window. You will need to expand the includes dropdown then you can navigate to the file as seen in the image below. 

    Then you can place a breakpoint in rangeProcHWA_ConfigHWACommon() and add hwaCommonConfig to the expressions window. 

    Best Regards,

    Josh

  • Hi Josh,

    Thank you for your reply.

    As shown in the below screenshot from CCS, I can trace the code step-by-step through debug mode and have set a breakpoint in rangeProcHWA_ConfigHWACommon(). I modified the code so that the configuration CLI commands can be automatically executed, but when I click on "Free Run" (Ctrl+F8), it seems that breakpoint is disabled and the program does not suspend at the breakpoint set in rangeProcHWA_ConfigHWACommon(). Instead, the program continues running.

    What should I do to make the program stop at the breakpoint set in rangeProcHWA_ConfigHWACommon()?

    Best regards,
    Daniel

  • Hi Josh,

    The program can now be suspended at the breakpoint set in rangeProcHWA_ConfigHWACommon(). Thank you for your support.

    Best regards,
    Daniel