Other Parts Discussed in Thread: AWR1843
Tool/software:
I am using AWR1843 with DCA1000 EVM for getting raw data.
After getting raw data using mmWave Studio Application, I have clicked on postProc button to view the plots for the data.
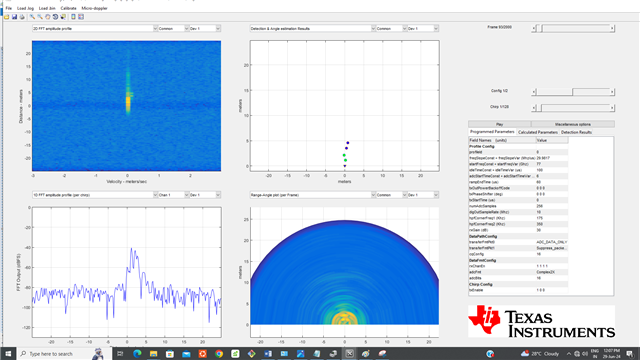
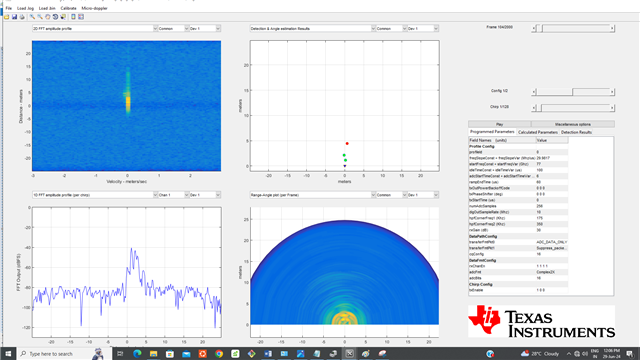
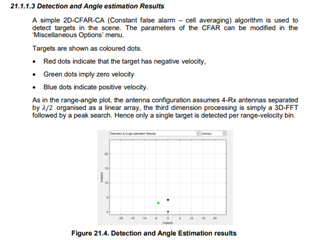
In the "Detection & Angle Estimation Results" plot displayed in RadarStudio postProcessing window, the point clouds are appearing with three colors.
The green color point clouds represent the actual targets, because they are appearing in every frame.
But in frame 93, I see some point clouds appearing with blue color, in frame 104 some point cloud appearing with red color
My question is "What does this blue color, red color represent. I believe if the false alarms are present, they should be represented as one color only. Should I take the blue color point clouds as clutter?"
Here are the plots of frame 93,104:


