This thread has been locked.

If you have a related question, please click the "Ask a related question" button in the top right corner. The newly created question will be automatically linked to this question.

AWR6843AOP: 6843AOP Antenna measurement

Part Number: AWR6843AOP

Tool/software:

Hi Ti experts,

We want to measure AWR6843AOP's antenna pattern .
Some E2E's reply suggested us by using DCA1000 and mmWave studio.
But the mmWave sensor PCB made by ourselves.
We don't reserve the 60 pin connector on the PCB, so It can't connect the DCA1000.
Can you give us some method to control the Tx and Rx?
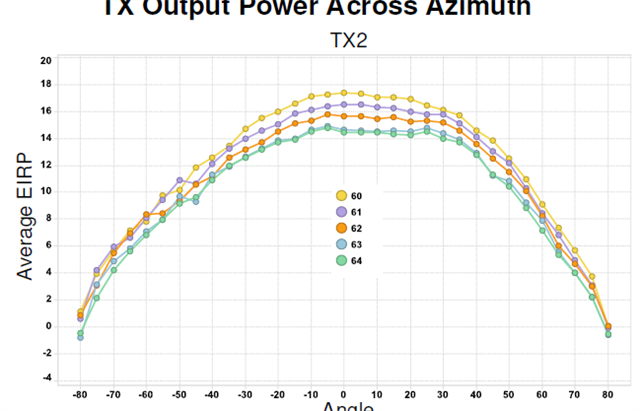
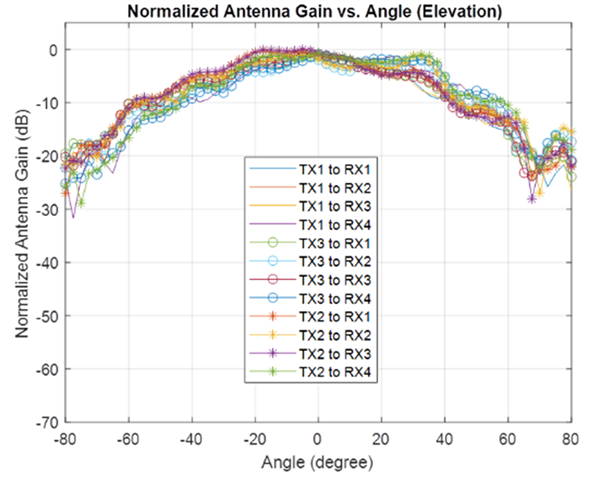
I want to get the antenna pattern like this.


BR, 
Vincent

  • Hi Vincent,

    The plots which you have posted are the TX power radiated plots and TX-RX loop back gain plots. Both these results are obtained by keeping the board inside a completely sealed anechoic chamber. 

    The TX output power is measured by placing the board on a motorized rotator and chirping in continuous wave mode at specific frequencies. The board is then rotated in both azimuth and elevation plane at step angles and the TX power at each step is received by a horn antenna placed at the bore sight. The horn antenna is connected to a power meter which records the power value and is stored in PC. This power measurement is plotted against the angle values to get the radiation pattern for both azimuth and elevation at specific frequencies. For chirping in CW mode, you have to connect the device with mmWave Studio using RS232 for downloading firmwares and SPI interfaces for sending APIs

    The loop back gain is measured with a corner reflector in the anechoic chamber. Similar to the first measurement, the sensor is mounted in a motorized rotator.  The automation script will capture raw data of different rotation angle.  FMCW signal will be sent, reflected back and go through the RX chain.  Different FMCW chirp configuration will result in slightly different radiation pattern because the gain is related to the frequency. The post processing: 2D FFT (range and Doppler FFT) is used to post processing the raw ADC data.  The power of (range, Doppler) bin, that represent the target, is recorded for every antenna pair to plot this gain curve.  The value of this power is related to the TX power, TX antenna gain, RX antenna gain, propagation loss, RCS, processing gain, and scale change, which is hard to interpolate.  Therefore, we only use the relative value in this figure to understand the radiation pattern, i.e., the gain change over the rotation angle.  In addition, this gain represents the combination of TX antenna gain and RX antenna gain.

    Thanks,

    Sreedeep

  • Hi Sreedeep,

    I understand the steps and principles you mentioned, but I found that mmWave studio requires DCA1000 to operate.
    As I mentioned, I have no way to connect the DCA1000 to my PCB, so I would like to ask if there is any other way to measure the antenna pattern.

    BR,
    Vincent

  • Hi Vincent,

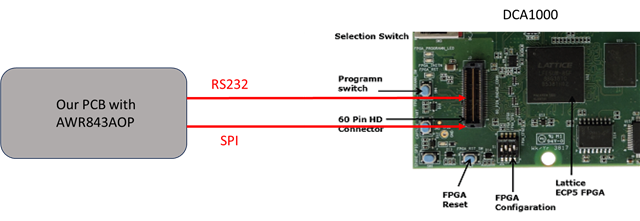
    You can connect to studio without DCA 60 pin connection through just RS232 and SPI connections. For these connections you can even use a blank EVM and DCA1000 and enable the SPI lines in EVM to connect it with the custom board. Using studio, you can put the device into CW chirping mode and use it to take the first plot.

    For the second plot, you need to capture data through SPI. Let me check on how to enable SPI based data capture AWR6843AOP and I will get back to you on that.

    Regards,

    Sreedeep

  • Hi Sreedeep,

    Do you mean I need to pull out the RS232 and SPI lines to connect to the DCA1000?

    I'm curious how other Ti customers measure EIRP. The information on E2E is very complicated and confusing.
    For Bluetooth and WiFi functions, Ti has launched a GUI tool to operate customers' products. Isn't there a simpler way for mmWave products?
    Faced with the EIRP test items during FCC certification, what would you advise customers to do?

    BR,
    Vincent

  • Hi Vincent,

    Yes, you can pull out the RS232 and SPI lines and connect it with DCA as studio connectivity for device configuration is possible just with SPI and RS232.

    Every customer uses the studio as the GUI for putting the device in CW mode and then measure the power readings across angles using a power meter inside an anechoic chamber to get the EIRP plots. 

    For loopback gain plots you should capture raw ADC data from the device which is only possible through LVDS in AWR6843AOP. So, without the 60pin header you cannot take loop back gain plots.

    Regards,

    Sreedeep

  • Hi Sreedeep,

    Thanks for your reply.
    Can I use mmWave demo visualizer to get the EIRP plots?
    Because the visualizer can create FMCW to the spectrum analyser, and we setting maximum hold function on it.
    Can we get the same result this way?

    BR,
    Vincent

  • Hi Vincent,

    As you can see in the EIRP plots, it is taken for fixed frequencies. So, the device should chirp in CW mode instead of FMCW mode which can only be set using studio.

    Regards,

    Sreedeep