Because of the holidays, TI E2E™ design support forum responses will be delayed from Dec. 25 through Jan. 2. Thank you for your patience.

This thread has been locked.

If you have a related question, please click the "Ask a related question" button in the top right corner. The newly created question will be automatically linked to this question.

IWR6843ISK: 6843ISK

Part Number: IWR6843ISK

Tool/software:

I am using the 6843ISK along with the DCA1000 and Boost.  I am taking data using mmWave Studio.  I want to do my own Matlab analysis on the mixer output data.  I pulled up one of the Matlab example files, to mine the data.  This all seems fine so far.  But, I have started with just taking Real data, with the default of 128 chirps, 256 A/D samples/chirp, and 8 frames.  There is nothing in the Matlab file about the number of frames, so when the number of chirps is calculated based on the data size, it is 8x to large (it thinks there are 1024 chirps).  How are the frames organized in the raw data file?  I need to know so i can add the number of frames into the equation properly.  I want to start out by just being able to duplicate the mixer output time plots for each read channel.  

Regards,

Larry

  • Hello Larry,

    It is organized as shown below. So you will have 128 chirps per frame, then the 129th chirp you will see is the first chirp of the second frame.

    Going to page 9 of this document below will give more details.

    https://www.ti.com/lit/swra581

    Best Regards,

    Pedrhom

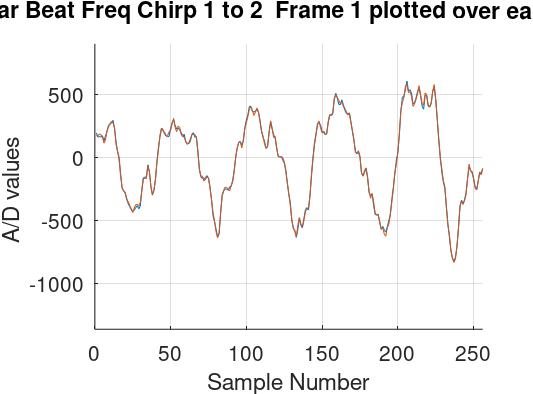
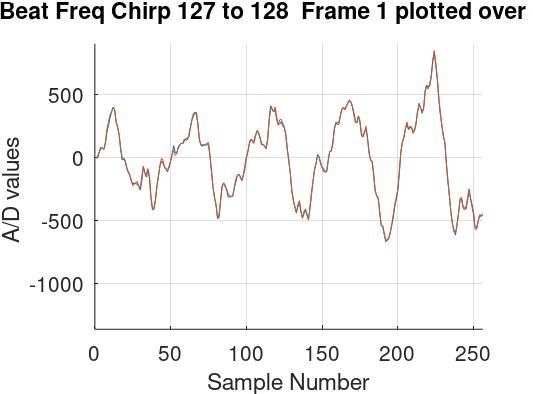
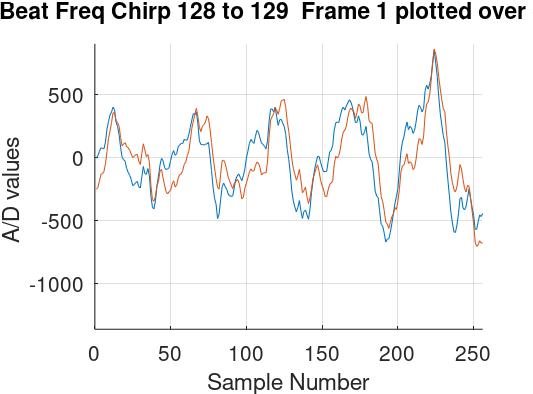
  • It doesn't seem like this is totally correct.  Here is why....I take the first 256 A/D samples from Rx0 of chirp 1, and compare it to the 256 A/D samples of Rx0 of chirp 2.  They graph almost on top of each other.  Very close.  Then I go to chirp 127, and plot the 256 A/D samples of Rx0 against chirp 128 of the 256 A/D samples of Rx0.  These again plot almost on top of each other.  Very close.  But then  I plot chirp 128 of the Rx0 256 samples against chirp 129 (which should be the first chirp of Frame 2) of the Rx0 256 A/D samples, they are not very close.  They do not plot nearly on top of each other.  What is different about this boundary when I thought it was just another sequential chirp.   Is there a long delay or something that would cause these consecutive chirp results on on the same Rx to not be similar?  

    Thanks,

    Larry

  • Hello Larry,

    How long is the frame time? And were these measurements taken in a static, low noise scene?  In general, in a static environment, I would expect the data between frames to be close too as you say.  Could you post a picture of some sort or an example to help show the differences?  For example, if you can post the ADC data for chirp1, chirp2, chirp128, chirp129, chirp 130 and chirp 256. 

    Best Regards,

    Pedrhom

  • These were taken using a corner reflector at about 1 meter.  Low noise and static.  I will insert 4 plots I made.  

  • Hello,

    I see what you mean, in addition chirp1 and chirp 127 are very different as well. This is not expected, so I will need more information

    1. You are seeing this with 'real' data, are you also seeing this with 'complex'?

    2. Could you please post your chirp configuration here?

    3. Are you able to post your parsing script? Feel free to attach the script as is, I want to confirm there is nothing wrong with your equations for parsing.

    Best Regards,

    Pedrhom

  • Pedrhorn,

    I was expecting 1 to 128 to be somewhat different, since I was holding a small corner reflector at about 1 meter.  I will have some movement.  I did see that difference.  

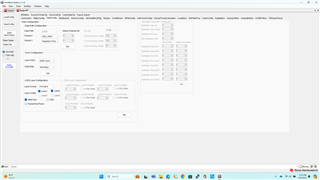
    For now, I am just looking at real data.  Config screen shots:

    %%mmWave1 is the name of this Octave file by LJK
    % written 08/22/24

    %%% This script is used to read the binary file produced by the DCA1000
    %%% and Mmwave Studio
    %%% Command to run in Matlab GUI -

    %% global variables
    % change based on sensor config
    close all
    filename = 'adc_data090624_3.bin';
    addpath('C:/Users/LarryKoudele/Desktop/6843ISK');
    %printf ("Filename is '%s'\n",filename);
    printf ("Filename is '%s'\n",filename);

    numADCSamples = 256; % number of ADC samples per chirp
    numADCBits = 16; % number of ADC bits per sample
    numRX = 4; % number of receivers
    numLanes = 2; % do not change. number of lanes is always 2
    isReal = 1; % set to 1 if real only data, 0 if complex data0
    Numframes = 8;
    numChirps = 128;
    %% read file
    % read .bin file
    fid = fopen(filename,'r');
    adcData = fread(fid,"int16"); %doesn't get back a int16?
    % if 12 or 14 bits ADC per sample compensate for sign extension
    adcData = int16(adcData);


    if numADCBits ~= 16
    l_max = 2^(numADCBits-1)-1;
    adcData(adcData > l_max) = adcData(adcData > l_max) - 2^numADCBits;
    end
    fclose(fid);
    fileSize = size(adcData, 1);
    % real data reshape, filesize = numADCSamples*numChirps
    if isReal
    numChirps = fileSize/numADCSamples/numRX;
    LVDS = zeros(1, fileSize);
    %create column for each chirp
    LVDS = reshape(adcData, numADCSamples*numRX, numChirps);
    %each row is data from one chirp
    LVDS = LVDS.'; %makes each row a column. Now, rows are the chirps.
    else
    % for complex data
    % filesize = 2 * numADCSamples*numChirps
    numChirps = fileSize/2/numADCSamples/numRX;
    LVDS = zeros(1, fileSize/2);
    %combine real and imaginary part into complex data
    %read in file: 2I is followed by 2Q
    counter = 1;
    for i=1:4:fileSize-1
    LVDS(1,counter) = adcData(i) + sqrt(-
    1)*adcData(i+2); LVDS(1,counter+1) = adcData(i+1)+sqrt(-
    1)*adcData(i+3); counter = counter + 2;
    end
    % create column for each chirp
    LVDS = reshape(LVDS, numADCSamples*numRX, numChirps);
    %each row is data from one chirp
    LVDS = LVDS.';
    end
    %organize data per RX
    adcData = zeros(numRX,numChirps*numADCSamples);
    for row = 1:numRX
    for i = 1: numChirps
    %adcData(row, (i-1)*numADCSamples+1:i*numADCSamples) = LVDS(i,row*numADCSamples+1:row*numADCSamples); %this was wrong from TI
    adcData(row, (i-1)*numADCSamples+1:i*numADCSamples) = LVDS(i,(row-1)*numADCSamples+1:row*numADCSamples); %this is correct now LJK
    end
    end
    % return receiver data
    retVal = adcData;


    xmax = numADCSamples;
    Rx = 1 %Read antenna Rx 1 to 4
    RefChirp = 1;
    RefData = adcData(Rx,(RefChirp-1)*xmax+1:RefChirp*xmax);
    %numADCsamples = 256 typically
    %ChirpNum = 1 to 1024
    ChirpNum = 50;
    %RefData = adcData(Rx,1:256);
    xx = 1:xmax;
    figure(Rx);
    hold on
    plot(xx,RefData);
    axis([0 xmax min(adcData(Rx,:)) max(adcData(Rx,:))])
    title("Radar Beat Freq")
    xlabel("Sample Number")
    ylabel("A/D values ")
    grid on
    xxx = adcData(Rx,(ChirpNum-1)*xmax+1:ChirpNum*xmax);
    plot(xx,xxx);

  • Hello Larry,

    This may be due to BPM being enabled, A + B will be OK but A-B will look like no detection. Do you see the same thing when setting MIMO to TDM instead?

    Best Regards,

    Pedrhom