Other Parts Discussed in Thread: SYSCONFIG
Tool/software:
Dear Team,
I am trying to access the UART data from the EVM in both normal demo mode and hard-coded mode. While the demo file for the Vital Signs project works fine with the visualizer (in normal mode not hard coded), I am encountering issues when attempting to detect the header—specifically the magic sync word 0x01 0x02 0x03 0x04—and other TLVs.
Here is what I've done and the challenges I'm facing:
-
Baud Rate Configuration:
- In the configuration file, the baud rate is set to 1,250,000 by default.
- After sending the config file, the visualizer operates correctly.
- I then close the visualizer to monitor the data independently without resetting the EVM.
-
Monitoring UART Data:
- I open a terminal monitor application to verify the data received from the EVM in HEX mode.
- Despite the EVM continue to transmitting data, I cannot find the magic sync word in the header.
- Question: Is this the correct approach to monitor the incoming data? Should the terminal be set to the same baud rate as specified in the config file? (I have tried 1250000, 921600, 115200)
-
Reopening the Visualizer:
- Upon reopening the industrial visualizer without sending the config again (assuming the EVM retains the previous configuration since it hasn't been reset), I notice that:
- The visualizer defaults to a COM port at 115,200 bps.
- No data is displayed.
- Question: Why does the visualizer default to a different baud rate, and how can I resolve the issue of no data being displayed?
- Upon reopening the industrial visualizer without sending the config again (assuming the EVM retains the previous configuration since it hasn't been reset), I notice that:
-
Hard-Coding the EVM:
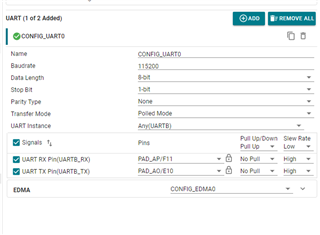
- In addition to setting the UART baud rate in the config file, I'm unsure if I need to modify the UART baud rate in SysConfig as well.
- When running in hard-coded mode:
- The EVM starts sending data over UART upon power-up.
- I still cannot detect the header or confirm if the data is correct.
- Question: Could this be due to a mismatch in baud rates or an incorrect configuration?
Given these issues, I attempted to first ensure that I could detect the header in normal demo mode for the Vital Signs project before proceeding further (in Hard coded mode) .
I would greatly appreciate any guidance or assistance on the following:
- The correct method to monitor UART data and detect the magic sync word.
- Proper settings for baud rates in both the config file and SysConfig.
- Steps to troubleshoot the lack of data display when reopening the visualizer.
Thank you for your support.
Best regards,
Jules
PS: My information are based on following docs regarding UART communication of the EVM :
https://dev.ti.com/tirex/content/radar_toolbox_2_20_00_05/source/ti/examples/Fundamentals/Hard_Coded_Config/docs/hard_coded_config_user_guide.html
https://dev.ti.com/tirex/content/radar_toolbox_2_20_00_05/source/ti/examples/Medical/IWRL6432_Vital_Signs/docs/vital_signs_user_guide.html
https://dev.ti.com/tirex/content/radar_toolbox_2_20_00_05/docs/software_guides/Understanding_UART_Data_Output_Format.html#tlv-header


