Other Parts Discussed in Thread: AWR2544
Tool/software:
Hello,
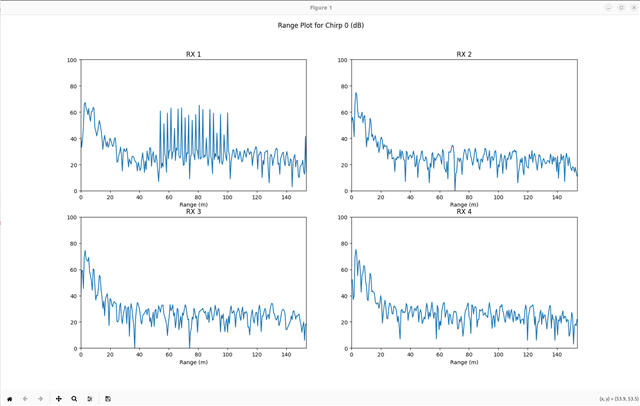
Problem: We're seeing occasional high/bad samples in the 1D range FFT data for the first receiver. This is seen from the Out of the Box demo software for the awr2544 with no modifications and are seeing this on multiple evm boards.
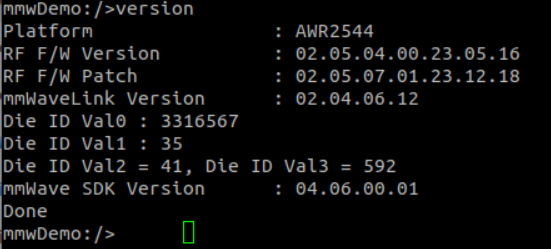
We've set up the AWR2544EVM and are using a freshly installed Linux machine using the mmWave SDK for the awr2544. Using this we've done the following steps:
1. connected the awr2544evm physically with XDS usb and ethernet
2. opened wireshark capture for udp ethernet traffic recording
3. Entered exact cli commands through a serial terminal using the (unmodified) profile_3d_3Azim_1ElevTx_TDM_awr2544_2Xmode.cfg (attached) provided for the demo example in mww/profiles/.
4. once sensorStart is issued, UDP traffic flows into wireshark and stored as a pcap file named tdm_ti_demo.pcap (attached)
5. then on the same machine the following command is ran to show visualization of the data data_parser_awr2544.py with pcap and .cfg as arguments.
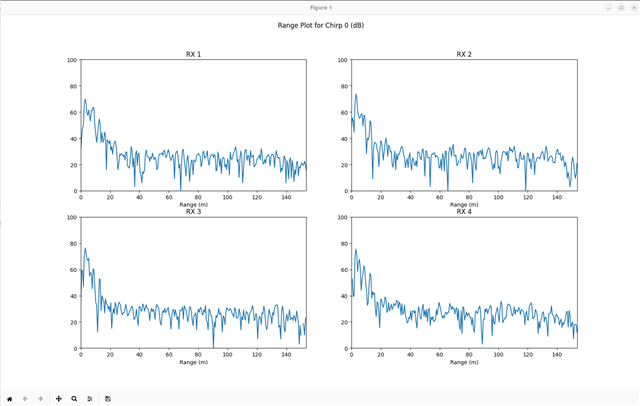
This script process the data and displays all 4 receivers for chirp 0 of tdm_ti_demo.pcap. Here is what most frames look like and is expected:

The problem we're running into are occasional "high samples" that occur in the first receiver. See below example frame from the same dataset as above:

I've included the TDM profile used for AWR2544EVM configuration as well as the pcap file for the above procedure + screenshots. Using the TI out of box demo visualizer, this issue is apparent about midway through the file in the receiver 1 plot.
Thank you,
-Ross B
profile_3d_3Azim_1ElevTx_TDM_awr2544_2Xmode.cfgtdm_ti_demo.zip


