This thread has been locked.

If you have a related question, please click the "Ask a related question" button in the top right corner. The newly created question will be automatically linked to this question.

AWR2243: the noise figures read from the two AWR2243 chips are different

Part Number: AWR2243
Other Parts Discussed in Thread: AM2732

Tool/software:

Hi, 

In the cascaded solution using AM2732 with 2* AWR2243;

I have conducted runtime calibration and boot-time calibration.

However, the RX gain and noise figures are inconsistent between the chips

my profile:

profileCfg 0.0000 78.000 5.0000 5.0000 20.0000 0.0000 0.0000 11.0000 0.0000 256.0000 20000.0000 0.0000 0.0000 180.0000

Rx gain:

devID:0

rxGainVal RF1: RX1:48.50, RX2:49.00, RX3:48.80,RX4:48.20 dB
rxGainVal RF2: RX1:48.60, RX2:49.10, RX3:48.90,RX4:48.30 dB
rxGainVal RF3: RX1:48.70, RX2:49.20, RX3:49.00,RX4:48.50 dB

devID:1

rxGainVal RF1: RX1:48.10, RX2:47.20, RX3:47.60,RX4:47.30 dB
rxGainVal RF2: RX1:48.10, RX2:47.30, RX3:47.70,RX4:47.50 dB
rxGainVal RF3: RX1:48.10, RX2:47.30, RX3:47.80,RX4:47.60 dB

devID0:

RxNoiseFig,devID0,Rx0: 13.50 dB,13.00 dB, 13.40 dB, temp:60
RxNoiseFig,devID0,Rx1: 13.60 dB,13.10 dB, 12.70 dB, temp:58
RxNoiseFig,devID0,Rx2: 13.20 dB,13.40 dB, 13.60 dB, temp:59
RxNoiseFig,devID0,Rx3: 13.80 dB,13.80 dB, 13.70 dB, temp:59

devID1:

RxNoiseFig,devID1,Rx0: 14.60 dB,14.40 dB, 14.10 dB, temp:60
RxNoiseFig,devID1,Rx1: 15.10 dB,14.70 dB, 14.90 dB, temp:58
RxNoiseFig,devID1,Rx2: 14.60 dB,14.30 dB, 14.40 dB, temp:59
RxNoiseFig,devID1,Rx3: 15.50 dB,14.80 dB, 14.80 dB, temp:59

my problem:

1、For  Rx0,The RX gains of Chip 0 and Chip 1 are very close, but there is a difference of 1-2 dB in their noise figures

2、Why is there a comparatively larger difference, approximately 1 to 2 dB, in the RX GAIN for the RX2/RX3/RX4 channels between Chip 0 and Chip 1, whereas the difference in RX GAIN for the RX1 channel is very small, less than 1 dB?

anyone can help me?

  • Hello Miles,

    differences of 1-2 dB between chips is very normal and nothing to be concerned about.

    Regards,

    James

  • ok,thank you!

    But now I'm encountering a phenomenon: when a person approaches the radar from a distance of 150 meters, some frames will have 7 to 8 point clouds,

    while others may only have 1 to 2 point clouds, or even no point clouds at all; this situation persists until the person is approximately 65 meters away from the

    radar before it stabilizes.

    And it appears that this phenomenon recurs in a cyclical manner according to this period.

  • Hello Miles,

    a human does not have a very large radar cross section compared to e.g. a car, so at 150 meters you may need to do additional engineering of the profile to detect the person.  you can reference this app note

    mmWave Radar Sensors: Object Versus Range (Rev. A) (ti.com)

    and also this app note for some basic understanding of how to increase maximum range:

    ti.com/lit/an/swra553a/swra553a.pdf?ts=1663338455889

    And this lab, which has some pointers/ideas on how to increase range:

    Range Tuning Guide (ti.com)

    Regards,

    James

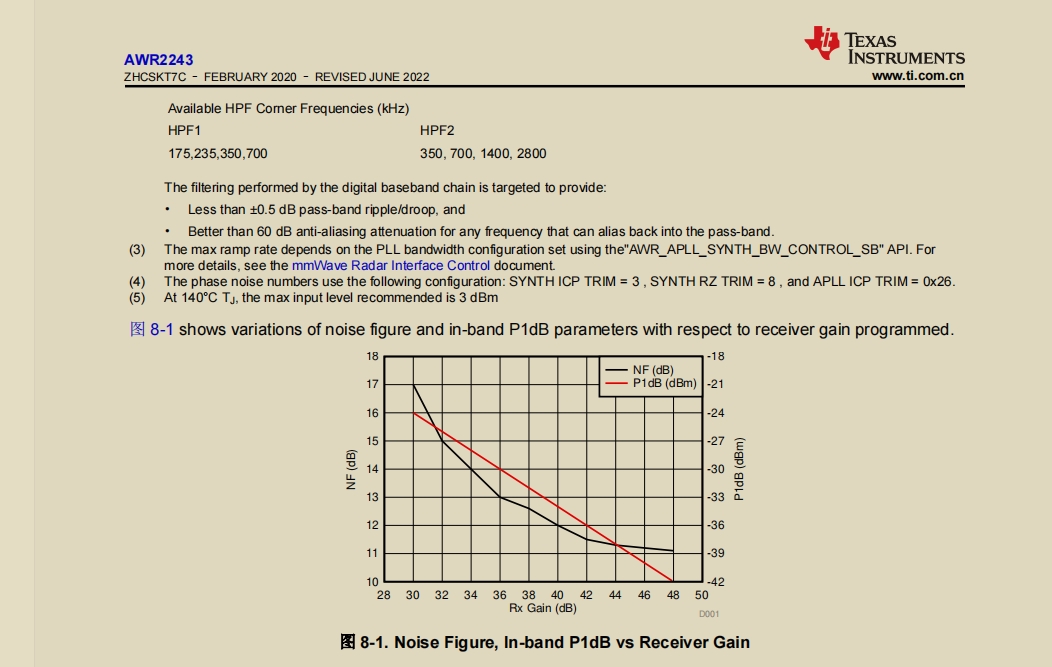
  • Hi, when RX Gain is 48,the NF will be 11, according this pictute;

    Now, devID0 and devID1 ,RX Gain is 48,

    but the NF:

      devID0 is 13dB.

      devID1 is 15dB.

    then, Compared to the standard diagram provided by TI, Chip 0 has a difference of 2dB, while Chip 1 has a difference of nearly 4dB. What are the reasons for this?

  • Hi Miles,

    There are a few things to consider here:

    1. It's very typical for there to be several dB of variation from part to part.  You need to measure a very large number of parts to get an accurate understanding.  It appears that you have two devices which are a bit over the average for NF, but statistically this can happen.

    2. If you are using the on-chip monitor to measure NF, its also important to note that the NF is measured by loopback of the TX into the RX.  Therefore, slight variations in matching at the TX can impact the accuracy of the monitor by a few dB, since the chip uses an estimate of the power coupled back into the RX to estimate the noise figure.  

    Regards,

    James

  • Hi James,

    Thank you for your response!

    I'm currently looking to optimize the noise figure and try to get it as close as possible to what's shown in TI's official documentation, for example, achieving a

    noise figure of 11dB when the RX GAIN is set to 48dB. Could you please let me know if there are any methods to achieve this, as this metric will significantly

    impact my detection capability?

    Best Regards!

    Miles

  • Hi Miles,

    Also, I need to let you know that the NF monitor is very susceptible to interference, so we don't usually recommend its use. 

    Generally, the noise figure will improve with higher gain, as shown in the plot (however, be careful since higher gain also reduces linearity, so can result in more spurs).  Also, the noise figure improves as you reduce loss into the device, so its important to keep the trace loss to the antenna and the antenna efficiency as high as possible.

    Regards,

    James

  • Hi James,

    Thank you for your reply!

    During my testing, the radar antenna surface was tightly attached to a large piece of microwave absorbing material, so there should not be much interference.

    Regards,

    Miles

  • Hi James,

    Therefore, I don't think there should be too much interference. So, I'm wondering why there is such a large difference between the NF I measured and the one in TI's official testing, and how I can improve or avoid this issue. Thank you.

    Regards,

    Miles

  • Hi Miles, 

    the monitor itself is not recommended for use, so it's difficult to conclude based on using it that the NF is too high.  Additionally the variation you are seeing should not be problematic.  

    Regards,

    James

  • Hi James,

    Thank you very much for your reply! While I acknowledge that NF (Noise Figure) may not provide absolute conclusions, I believe it can offer some relative insights. Please consider these sets of NF data I have tested. The radar was tested in close proximity to the wave-absorbing material, with no other factors influencing the results. Each set of data was collected for approximately 5 minutes, with only the gain configuration varying between sets. I have conducted a statistical analysis by taking the maximum, minimum, and average values of the data for reference. I believe that the average values over this period hold some significance. From the data, we can observe the following phenomena:

    1. For most of the data, the fluctuations between the maximum and minimum values are relatively large. Even in the file named "78G_EM_ABSORB_44", the maximum NF measured by RF2 ranges from 37 to 42, and the maximum NF measured by RF3 exceeds 50. What could be the reason for such large fluctuations?

    2. If you look at the average values for each RF in each file, you'll notice that Chip 1 generally has a higher NF than Chip 0. Based on my analysis, this could be due to differences in the gain of the two chips. However, what factors contribute to these differences in gain?

    3. Additionally, as observed from the data, the NF values of RF1 appear to be more normal compared to RF2 and RF3. May I ask why the performance of RF2 and RF3 is relatively poorer?

    2627.noise figure data.docx

    Regards,

    Miles

  • Hi Miles,

    I understand your analysis was very thorough, but the R&D teams have told me that we have deprecated the NF monitor due to it having some issues, and therefore it would be better to estimate noise based on the raw ADC values.

    Regards,

    James

  • Hi James,

    Thanks for your reply!

    Yes, I would like to proceed with collecting and analyzing raw ADC data next.

    Regards,

    Miles

  • Hi Miles,

    Makes sense, good luck!

    Regards,

    James