This thread has been locked.

If you have a related question, please click the "Ask a related question" button in the top right corner. The newly created question will be automatically linked to this question.

AWR2243BOOST: pointcloud looks incorrect, z-axis point incerase for the the object walks away from radar

Part Number: AWR2243BOOST

Tool/software:

Dear Experts,

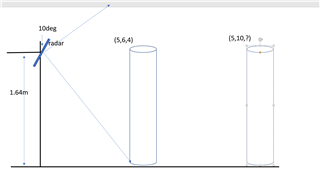
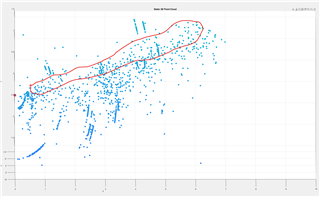
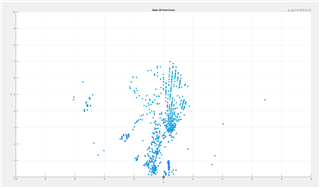
I have ppintcloud data from the setup showed in image and the pointcloud looks bit off , as the z-axis changes drastically for the same ground plane I have shared the side view(yz) and and top view xy. the person walk close then z reduces and increase as the person far away. in theory it is correct but how do I make correct and relative to ground plane. I did the required translation still the same 

I did try with tilt angle trnalsate but still?

also how can I make the potincloud more dense, I was using the default config for 3D point over ethernet, the dataszie should not be problem.

Best regards,

DM

   profile_3d_am273x.cfgprofile_enet.cfg

  • Hi,

    To increase the point cloud size, one way is to lower the threshold in the configuration.

    Thank you

    Cesar

  • okay, which threshold?

    and what about the big shift here in this data ? in the z-axis, why is it moving up for objects moving away on the same ground plane?

    Best regrdas,

    DM

  • Hi DM,

    You can start by adjusting the CFAR threshold in the config (cfarCfg). Please note the tradeoff between the number of detected points and the number of false detections :https://e2e.ti.com/support/sensors-group/sensors/f/sensors-forum/1354918/awr1843-what-is-mean-by-cfar

    As for the shift in the z-axis, could you provide details on how you are doing the angle translation?

    Thank you,

    Jin

  • hi jin,

    this my logic

    % Constants
    sensor_height = 1.64; % Sensor height in meters
    inclination_angle_deg = 10; % Inclination angle in degrees
    inclination_angle_rad = deg2rad(inclination_angle_deg); % Convert to radians
    % Shift coordinates to sensor's local frame (centered at sensor position)
    z = z - sensor_height; % Adjust for sensor height
    % Rotation matrix for tilt about x-axis (inclination correction)
    rotation_matrix_x = [
    1, 0, 0;
    0, cos(inclination_angle_rad), -sin(inclination_angle_rad);
    0, sin(inclination_angle_rad), cos(inclination_angle_rad)
    ];
    % Combine x, y, z into a matrix for transformation
    coordinates = [x, y, z];
    % Apply rotation to correct inclination
    corrected_coordinates = (rotation_matrix_x * coordinates')';
    % Extract corrected x, y, z
    corrected_x = corrected_coordinates(:, 1);
    corrected_y = corrected_coordinates(:, 2);
    corrected_z = corrected_coordinates(:, 3) + sensor_height; % Adjust back to global height
    best regards,
    DM
  • Hi DM,

    Thanks for sharing. Can you check if you are seeing the same issue occurs when the sensor is mounted at 0 degrees (no tilt)? 

    Also, what is the visualizer from? If it is a custom visualizer, is it based on any TI reference?

    Thank you,

    Jin

  • Hi Jin,

    for late reply, the pointcloud from no tilt is not that off as it was. but still could you share some guide about tilt effect on pointcloud also a config to get good poincloud for small ball to human detection with high dense pointcloud for up to 70meter. this is my matlab logic to plot the points 

    %% DYNAMIC PLOTS
    if plotMode == 2
    % Create a figure for all dynamic plots
    figure('Name', 'Dynamic Plots', 'Position', [100, 100, 1200, 800]);
    % Iterate through unique timestamps and plot all points for each timestamp
    for tIdx = 1:length(uniqueTimestamps)
    % Get the indices for the current timestamp group
    currentGroup = (groupIndices == tIdx);
    currentX = X(currentGroup);
    currentY = Y(currentGroup);
    currentZ = Z(currentGroup);
    % Dynamic 3D Plot (X-Y-Z)
    subplot(2, 2, 1); % Top-left plot
    scatter3(currentX, currentY, currentZ, 100, 'filled', 'MarkerFaceColor', [0, 0.5, 1]);
    xlabel('X-axis');
    ylabel('Y-axis');
    zlabel('Z-axis');
    xlim(xLim);
    ylim(yLim);
    zlim(zLim);
    grid on;
    title(['Dynamic 3D Plot (X-Y-Z): Timestamp ', uniqueTimestamps{tIdx}]);
    % Dynamic Z-Y Plot
    subplot(2, 2, 2); % Top-right plot
    scatter(currentY, currentZ, 100, 'filled', 'MarkerFaceColor', [0.5, 0, 1]);
    xlabel('Y-axis');
    ylabel('Z-axis');
    xlim(yLim);
    ylim(zLim);
    grid on;
    title(['Dynamic 2D Plot (Z-Y): Timestamp ', uniqueTimestamps{tIdx}]);
    % Dynamic X-Y Plot
    subplot(2, 2, 3); % Bottom-left plot
    scatter(currentX, currentY, 100, 'filled', 'MarkerFaceColor', [1, 0.5, 0]);
    xlabel('X-axis');
    ylabel('Y-axis');
    xlim(xLim);
    ylim(yLim);
    grid on;
    title(['Dynamic 2D Plot (X-Y): Timestamp ', uniqueTimestamps{tIdx}]);
    % Pause for visualization
    pause(0.1); % Adjust for speed
    end
    end
    BR,
    DM
  • Hi DM,

    Thank you for the details. Assuming there is no tilt in the azimuth direction, could you try the following rotational matrix:

    [1, 0, 0;

    0, cos(elevTilt), sin(elevTilt);

    0, -sin(elevTilt), cos(elevTilt)]

    For a reference of how coordinates are rotated based on the tilt angles of the sensor, please refer to the updatePointCloud() function in the Applications Visualizer available for download in the Radar Toolbox (C:\ti\radar_toolbox_2_20_00_05\radar_toolbox_2_20_00_05\tools\visualizers\Applications_Visualizer\common\Common_Tabs\plot_3d.py).

    Regarding the config for your specific usecase, please start by defining your usecase parameters in the mmWave Sensing Estimator and modifying/testing the thresholds mentioned above as necessary. 

    For a more comprehensive overview of how chirp parameters affect radar performance, please refer to Programming Chirp Parameters in TI Radar Devices.

    Thank you,

    Jin