This thread has been locked.

If you have a related question, please click the "Ask a related question" button in the top right corner. The newly created question will be automatically linked to this question.

DRV5055-Q1: How to view the simulation results of two sensors in one chart

Part Number: DRV5055-Q1

Tool/software:


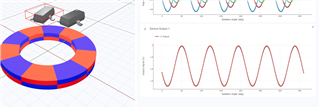
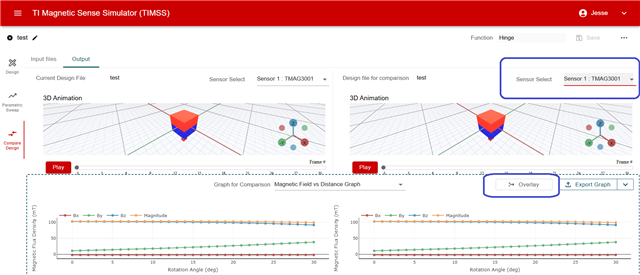
I use TIMSS to simulate two DRV5055. How can I view the simulation results of two sensors at the same time in one chart?
Thank you.
  • Hi,

    Thanks for posting your question to the Sensors forum and welcome to E2E!

    One option for viewing the simulation results of the two sensors at the same time on one graph is to use the "Compare Design" feature in TIMSS.

    • Click "Compare Design" in the bar on the left in the simulation environment.
    • Click "Browse My Designs" and select the same simulation to compare them and click "Simulate"
    • In the Outputs tab, make sure "Sensor 1" is selected on one graph and "Sensor 2" is selected on the other graph.
    • Click "Overlay" above the graphs to display the results at the same time on the same graph.

    Alternatively, from the normal simulation results tab, you can click the three dots in the top right corner next to "Save" and Export the report to CSV. This will allow you to analyze the data in excel or other data processing tools and create the graphs you need.

    Best regards,

    Jesse

  • Hi,

    Thank you.

    This resolved my issue.