This thread has been locked.

If you have a related question, please click the "Ask a related question" button in the top right corner. The newly created question will be automatically linked to this question.

IWR144:Point cloud visualization method using TI's mmWave sensor

Part Number: IWR1443BOOST
Other Parts Discussed in Thread: IWR1443, IWR6843, IWR6843AOP, UNIFLASH

Tool/software:

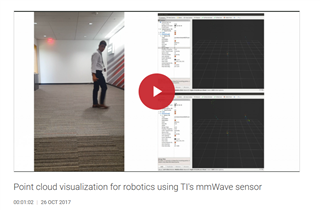
I would like to reproduce the demo video that is being conducted at the following link.
The video says to use a Robot OS compatible Linux PC, but is it possible to do the demo on a Windows PC?
Also, is there any other better way?

https://www.ti.com/zh-tw/video/5625804515001#transcript-tab

  • Hello,

    If what you are looking for is a pointcloud output from the mmWave Radar Sensor, then you can do so on windows by downloading the Radar Toolbox in the TI Developer Zone, and then use the Applications Visualizer to run the Out of Box demo.

    Best Regards,

    Pedrhom

  • ご回答ありがとうございます。

    このデモはIWR1443には対応していない認識でよろしかったでしょうか。
    人物の3Dトラッキングを実施するにはIWR6843を使用した方がよいのでしょうか。
    ご確認のほどよろしくお願いします。
  • Hello, 

    Can you please translate your post to English?

    Thanks,

    Josh

  • Thank you for your response.

    Am I correct in understanding that this demo is not compatible with IWR1443?
    Would it be better to use IWR6843 to perform 3D tracking of a person?
    Thank you in advance for your confirmation.

  • 1443 supports the out of box demo which does output a basic point cloud, but the 6843 has a DSP and more complex algorithms that allows the outputting of a more dense and accurate point cloud. It also has additional features such as tracking, and the demo with these features is the 3D People Tracking demo which does not support 1443.

    Best Regards,

    Pedrhom

  • I want to demonstrate 3D People Tracking in Industraial Visualizer, but I can't find the Configration data.
    Where is the data?The device used is IWR6843AOP.

  • Hello,

    Download the latest version of the Radar Toolbox here using the "Installing the Radar Toolbox" and "Via Web Browser" instructions:
    https://dev.ti.com/tirex/explore/node?node=A__AdPiz.4wb-E2N7VjUW8r.Q__radar_toolbox__1AslXXD__LATEST

    Flash 3D People Tracking using Uniflash

    C:\ti\<RADAR_TOOLBOX>\source\ti\examples\People_Tracking\3D_People_Tracking\prebuilt_binaries

    Run Applications Visualizer

    C:\ti\<RADAR_TOOLBOX>\tools\visualizers\Applications_Visualizer\Industrial_Visualizer

    Choose 3D People Tracking configuration

    C:\ti\<RADAR_TOOLBOX>\source\ti\examples\People_Tracking\3D_People_Tracking\chirp_configs

    Best Regards,

    Pedrhom

  • Hello,

    When doing 3D People Tracking
    Is there an optimal mounting height and angle for IWR6843AOP?

  • Hello,

    It depends on the application at hand. From a pure performance stand point, you will always get the best detection at 0 degrees angle and past a minimum distance of 10cm-20cm.

    Best Regards,

    Pedrhom

  • Hello,

    Thank you for your answer.

    I have some additional questions.
    1)Is there an optimal mounting height and angle for the sensor when tracking people in a room of about 6m x 6m?

    2)What is the maximum detection range of the sensor alone?

    3)Is it possible to detect a person behind a wall?

    4)With the current specifications, the ID disappears when the person stops moving. Is it possible to prevent it from disappearing?


  • Hello,

    1. With a large room, generally as high as possible with a 45 degrees angle.

    2. Depends on the configuration. Range resolution and maximum range come at a trade off. Detection of a human can easily be done at 20m + if configured for it with the trade off being range resolution.

    3. If the wall is on the thinner side like dry wall then yes. 

    4. Use a static retention configuration and ensure fineMotion parameter is on. Set it to something like fineMotionCfg -1 1 1.0 2 2. Increase static duration in tracker layer parameters as well.

    Best Regards,
    Pedrhom
  • Hello,

    Thank you for your answer.

    Is there any way to check data from two sensors with one software?
    If I have two rooms, I will install a sensor in each room,
    We want to combine that data to track people. Is there any good way to do this? I would like to have it as a reference.

  • The easiest way that is currently supported is using Linux + ROS. Here is an example of where we sync up four EVMs to create a 360 degree safety bubble

    https://dev.ti.com/tirex/explore/node?node=A__AWqvvxiwavyaKttoFoEI5w__radar_toolbox__1AslXXD__LATEST

    Best Regards,

    Pedrhom

  • Hello,

    What can you tell me about the stored JSON data?
    we want to know the value of each of the following data.
    The data I want are cluster ID, X,Y,Z coordinates, height, etc.
    For example, what does the following data mean?

                    "trackData": [
                        [
                            0.0,
                            -0.45256805419921875,
                            1.9496219310003418,
                            1.4621478115116777,
                            -0.17343421280384064,
                            -0.07737739384174347,
                            0.004924864508211613,
                            0.08255639672279358,
                            -0.24726815521717072,
                            0.03574766218662262,
                            3.0,
                            0.9412466883659363,
                            1.390716148473554e-307,
                            1.2794624555870492e-307,
                            8.344234927061825e-308,
                            8.90070286343755e-308

                    "heightData": [
                        [
                            0.0,
                            2.0421512126922607,
                            1.3877983093261719
  • Hello,

    Within the Radar Toolbox we have the UART Output guide covering every type of output possible from our Radar Demos.

    https://dev.ti.com/tirex/explore/node?node=A__AaagUFIod1NcG0sE-noAfw__radar_toolbox__1AslXXD__LATEST

    Within ROS, "trackData" is the output of the tracker which is a clustering algorithm that will determine if a group of points should be considered a person or not. Then each cluster, or track, will have its own information representing the characteristics of the track.

    This TLV is Type 308 aka MMWDEMO_OUTPUT_EXT_MSG_TARGET_LIST. You will find it on that link above.

    Best Regards,

    Pedrhom

  • Hello,

    Thank you for your response.

    Regarding the configuration data used in 3D People Tracking.
    Do you have any documentation describing the contents of the following configuration files?
    I would like to change the setting values.
    C:\ti\radar_toolbox_2_30_00_12\source\ti\examples\Industrial_and_Personal_Electronics\People_Tracking\3D_People_Tracking\chirp_configs
    ・AOP_6m_default
    ・AOP_6m_staticRetention

  • Hello,

    I would like to analyze the point cloud data obtained from 3D People Tracking in Industrial Visualizer.
    In the saved JSON file, there is an entry called "pointCloud." Does this refer to the point cloud data?
    Additionally, I would like to understand the meaning of the following values:

    "pointCloud": [
                        [
                            0.4328698122151555,
                            1.4286174734507147,
                            1.7270855280880597,
                            0.06972000186215155,
                            32.63999927043915,
                            0.0,
                            255.0
                        ],


    Could you please explain what these values represent?
    I couldn't find any documentation to refer to.

  • As mentioned before, all messages are ROS's output structure representing one of the many TLVs the Radar outputs.

    https://dev.ti.com/tirex/explore/node?node=A__AaagUFIod1NcG0sE-noAfw__radar_toolbox__1AslXXD__LATEST

    Within a ROS project, you can check the msg folder to see the message itself's format.

    Best Regards,

    Pedrhom