This thread has been locked.

If you have a related question, please click the "Ask a related question" button in the top right corner. The newly created question will be automatically linked to this question.

OPT4048DTSEVM: Sensors forum

Part Number: OPT4048DTSEVM
Other Parts Discussed in Thread: OPT4048

Tool/software:

Hello Support Team,

I have some issues with the OPT4XXX viewer python scripts. Can you provide a newer version of the scripts, please? There are several features that are not working.

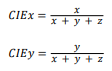
- The CIE XY values on the upper right corner does not match the plot. However, the U and V values do. How can I adjust the X and Y values to macth the plotting?

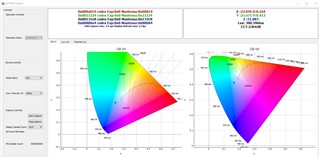
- Can we add the X and Y values to the plot, next to the dot? 

- Can we add more dots plotted into the CIE XY and CIE UV to track color changes? Do the points plotting function below make that?

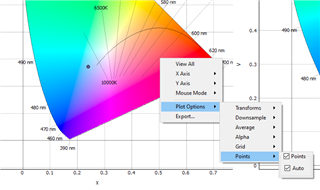
- JPG, PGN.... etc. are not exportable. Same as Matplotlib

  • Hi Luis,

    These are the latest scripts for the OPT4048. To your points:

    1. The GUI is displaying X, Y, and Z values, not CIEx and CIEy which is mapped in the image. To convert these values into coordinates, you can calculate them using the following set of equations:

    2 and 3. We currently do not have these features and were never intended to be a part of the final GUI. However, this does seem like something we should consider for future versions.

    4. Let me look into this. I will follow up tomorrow.

    Thanks,
    Daniel

  • Hello Daniel,

    Thank you for the explanation on the CIE XY values.

    Regarding the plotting functions of the OPT viewer, there are several features that are not working...unfortunately, they will be very useful for testing and development process, this includes the: transform, points, alpha...etc.

    Regards,

    Luis

  • Hi Luis,

    I understand, but these are not features that were meant to be included in the released GUI, so we do not have an "updated" GUI that we can share. We will keep this in mind for future releases and then we might go back and implement these features; however, we do not have a plan to rerelease this GUI in the foreseeable future.

    If you want to make changes, all of the code is available in the scripts window.

    Thanks,
    Daniel

  • Hello Daniel,

    Thank you for your answer and follow up.

    If you, TI, are not able to implement the new plotting features now, which I fully understand, at least you could fix the current tool plotting issues i.e., points, average, and image format export.

    Thank you!

    Luis

  • Hi Luis,

    Sure, I can see what we can do about the current features that are not working and I will update ASAP.

    Thanks,

    Daniel