


Tool/software:
Hi Ti expert,
I am currently using Python to extract range profile curve values from the mmWave Visualizer.
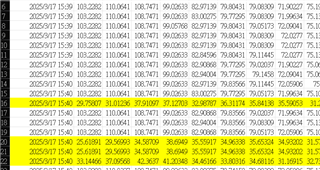
However, I noticed that when reading data for 100 seconds, some abnormal values appear. Is this situation normal?
What does it mean when I capture values that are smaller than expected?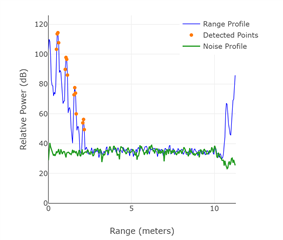
BR,
Vincent
