This thread has been locked.

If you have a related question, please click the "Ask a related question" button in the top right corner. The newly created question will be automatically linked to this question.

AWR6843ISK: AWR6843ISK

Part Number: AWR6843ISK
Other Parts Discussed in Thread: SYSBIOS, AWR6843

Tool/software:

Dear sir/madam

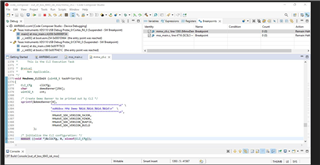
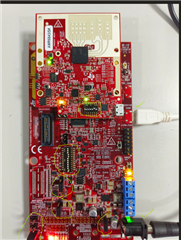
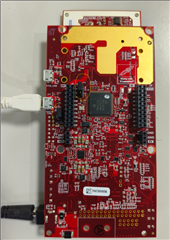
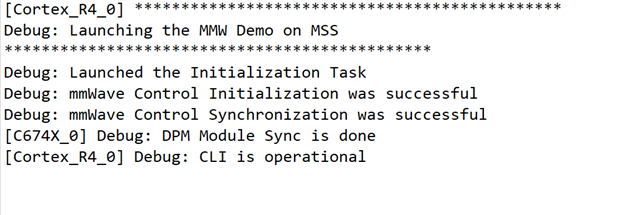
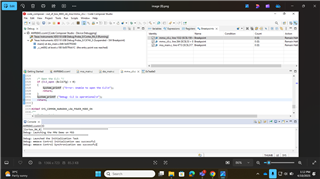
  we are using AWR6843ISk + mmwave booseter setup . and able to run the "out of box demo" example  project  on  debug mode on code composure studio .

we are able to set breakpoint and debug the code at particular steps where break point is set.

My question:

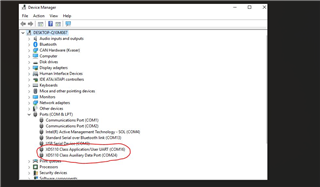
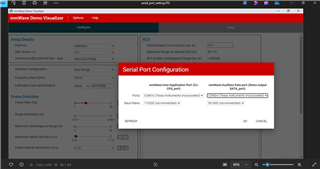
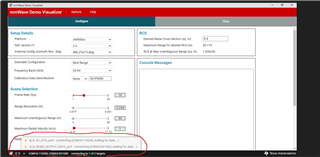
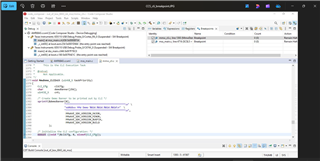
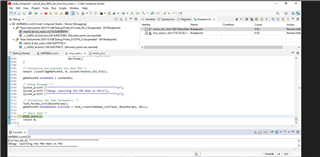
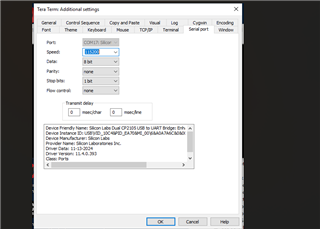
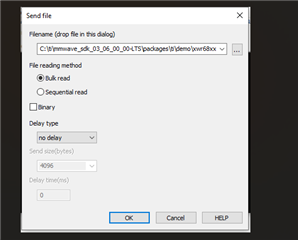
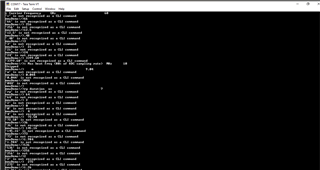
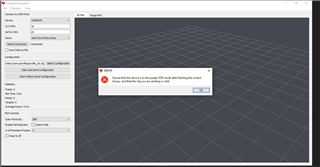
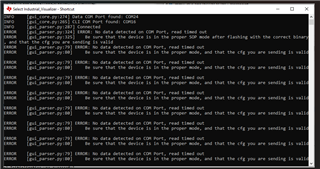
 1.if i want to set breakpoint inside the mmw_cli.c file ,radar configuration need to be send via mmwave visualizer tool.since UART connections are already used by Debug mode ,i am unable to send configuration file 

by mmwave visualizer tool(because unable to setup the serial connection)

   please suggest  me ,how to  send config file to front end and setup break point inside the mmw_clic.c code in debug mode?

  Regards,

mani

  • HI, Mani:

    CCS is using JTAG,  does not hold UART, unless you open a serial terminal in ccs (which you should not).

    Make sure you are close other terminal like Tera Term, Flasher and other visualizer.   

    If the online visualizer still give you trouble, you can switch to industrial visualizer located inside radar toolbox (you can download the radar toolbox RTB at https://dev.ti.com/tirex/explore/node?node=A__AEIJm0rwIeU.2P1OBWwlaA__radar_toolbox__1AslXXD__LATEST).

    The industrial visualizer is located inside the RTB at relative folder .\tools\visualizers\Applications_Visualizer\Industrial_Visualizer

    Best,

    Zigang

  • hi zigang,

      thanks for your resply.

    As you suggested ,i have tried with industrial visualizer  running AWR6843ISK card alone(flash mode: loaded outofbox demo .bin file and running in functional mode) - industrial  visualizer is working and able to see the detection.

    when we run on debug mode (AWR6843ISK+mmwave booster card) -able to run debug mode and set the break point on the mss_main.c file and breaking happening correctly .but Unable to run with both Industrials and mmwave Visulaiser 3.6 vesrsion(screenshots are attached) to break at mmw_clic.c file break point set place.

    1.device manager Port details

    2.mmwave Visualizer port settings:

    3.mmwave visualizer connection error:

    4.industrail Visualizer error: 

    5.break point set one inside mss_main.c and another one inside mmw_cli.c 

    6.breakpoint executed and stopped successfully inside mss_main.c(console shows statement executed till breakpoint)  


    Please look into the issue ,kindly suggest how run in debug mode ,settings breakpoints at various point of the code and executing by simultaneously sending necessary configuration file and operating parameters  from mmwave visualizer /industrial visualizer.

    regards,

    mani

  • Hi, Mani:

    So AWR6843ISK board works for itself. 

    How about AWR6843ISK + ICBooster board?  Does it work in function mode without using CCS?

    if not, can you check the switch settings on AWR6843ISK and ICBooster at the following link? or sending the setup picture for me to review. 

    https://dev.ti.com/tirex/explore/node?node=A__AaisfE8Ba9jHLpzgifeaCQ__radar_toolbox__1AslXXD__LATEST

    Best,

    zigang

  • Hi zigang,

     thanks for your reply.

    your question :How about AWR6843ISK + ICBooster board?  Does it work in function mode without using CCS?

     yes ,its working in function mode both in AWR6843ISK alone and also in AWR6843ISK + ICBooster board setup.

    but not running function mode using AWR6843ISK + ICBooster board setup with CCS debug mode.

    I m sharing screenshot of AWR6843ISK and ICBooster setup ,switch settings(both front and backside of board for your reference).

    My additional comments:

    when we run on debug mode (AWR6843ISK+mmwave booster card) -able to run debug mode and set the break point on the mss_main.c file and breaking happening correctly .but Unable to run with both Industrials and mmwave Visulaiser 3.6 vesrsion to break at mmw_clic.c file break point set place.

    As per design,mmw_clic.c can enter into code post receiving configuration via serial interface. This step  is not happening ,because we are unable to connect to industrial /mmwave visualizer to send the configuration file. 

    Regards,

    Mani

  • HI, Mani:

    Can you send the CLI configuration file through Tera-term, and see whether you can get CCS debug working?  I will try on my side with the industrial visualizer.

    Best,

    Zigang

  • Hi ziganag,

    As you requested , we try to send via tera tearminal.

    AWR6843ISK card alone standalone mode(not debug mode) flashed with out of box demo.bin file. then moved to functional mode.

    we try to send Configuration file available with demo example "C:\ti\mmwave_sdk_03_06_00_00-LTS\packages\ti\demo\xwr68xx\mmw\profiles\profile_3d.cfg"

    via tera terminal(instead of industrial visualizer). we could not able to run it sucessfuly.

    the screenshots of step by step is attached for your reference:

    step 1:

    1.

    Step 2:

    step 3:

    step 4:

    my question: 

    1. can you guide us correct way of sending CLI commands via tera or where can I get correct CLI command?

    2. your previous reply:

         Can you send the CLI configuration file through Tera-term, and see whether you can get CCS debug working?  I will try on my side with the industrial visualizer.

      my question: did you check it,can you tell me ,how to  send config file to front end and setup break point inside the mmw_clic.c code in debug mode?

    regards,

    mani

  • Hi, Mani:

    I tried following

    1) Flash the OOB demo binary on the AWR6843ISK + ICBooster, and run the industrial visualizer with the configuration file

    C:\ti\mmwave_sdk_03_06_02_00-LTS\packages\ti\demo\xwr68xx\mmw\profiles\profile_3d.cfg

    It looks fine.

    2) Flash C:\ti\mmwave_sdk_03_06_02_00-LTS\packages\ti\utils\ccsdebug\xwr68xx_ccsdebug.bin. 

    3) Port the CCS project from toolbox directory (radarToolboxFolder\source\ti\examples\Out_Of_Box_Demo\src\xwr6843ISK), note that I changed the SDK version inside projectspec to be 03.06.02.00-LTS because I only have the latest SDK version on my PC.

            <property name="products" value="com.ti.rtsc.SYSBIOS:6.73.01.01;com.ti.MMWAVE_SDK:03.06.02.00-LTS;"/>

    4) Re-build the dss project out_of_box_6843_isk_dss and then build the mss project out_of_box_6843_isk_mss. 

    5) Launch xWR6843.ccxml, connect both core and load the binary, run the DSP core first, followed by ARM core.   You will see the following on the console window

    6) Start the industry visualizer now, and connect the device, and load the same configuration file

    C:\ti\mmwave_sdk_03_06_02_00-LTS\packages\ti\demo\xwr68xx\mmw\profiles\profile_3d.cfg

    You can see the CCS window start sensor.

    Everything looks normal to me. 

    Best,

    Zigang

  • I also made two same breakpoint as you, and it first stopped at BIOS_start, then stopped at the CLIInit.  

    Best,

    Zigang

  • Hi zigang,

      thanks for your reply.we have tried as you suggested with "mmwave_sdk_03_06_02_00-LTS" instead of "mmwave_sdk_03_06_00_00-LTS". and we are getting the following issues(screen shot attached)

    1.the below errors are seen in industrial visualizer post sending the profile_3d configuration file

    2. breakpoint set at CLI does not reach in mmw_cli.c (but initial breakpoints in mss_main.c happens)


    please check  the issue and give solution.

    my question

    1.can you please share the steps you followed and able to run it successfully?

    2.we have tried same debugging Process with different application "AWR6843_CPD_with_Classification(instead of out of box ) " running on code composer in debug mode  and send configuration file using "AWR6843_CPD_w_Classification_visualizer.exe" by selecting "vod_6843_isk_frontMount_2row.cfg" file for AWR6843ISK

    Note: Industrial visualizer does not support  AWR6843_CPD_with_Classification application.

    can i check and confirm ,how to debug with AWR6843_CPD_with_Classification application?

    Regards,

    Mani

  • HI, Mani:

    1) The procedure for me is very standard.  

    2) The visuaizer for AWR6843_CPD demo is located at:

    radarToolboxFolder\tools\visualizers\InCabin_CPD_w_Classification_GUI

    The users guide can be found at:

    radarToolboxFolder\source\ti\examples\Automotive_InCabin_Security_and_Safety\AWR6843_CPD_with_Classification\docs

    Best,

    Zigang

  • Hi zigang,

    thanks for your reply.

    we could able to run AWR6843_CPD_with_Classification project on debug mode ,but   when we step into the code, it is observed the breakpoints are moving randomly.

    we found on Ti forum thread that this is due to code optimization settings and recommended to make optimization off will help running breakpoint with out issue.

    we have tried same way made optimization setting to "off"  with "AWR6843_CPD_with_Classification" project ,but we are getting the following  while building the project.

    please kindly check and provide the solution for the issue.

    regards,

    mani

  • HI, Mani:

    There are different optimization level, please choose level 2 for optimization.

    Best,

    Zigang

  • hi zigang,

    thanks for your reply.

    we have tried with all combination available and summary of result is attached for your reference(So random movement  observed, when we "step into" the code with breakpoint with all the cases).

    Optimzation level AWR6843_CPD_with_Classification project
    off build errors in dss code, mss built
    0 build errors in dss code, mss built
    1 build errors in dss code, mss built. Since, mss built checked mss main code but breakpoint movement is still random
    2 No build errors , but breakpoint movement is random
    3 No build errors , but breakpoint movement is random
    4 This level is not there in dss project , but there in mss. Continued to do so but breakpoint movement is random

    My question: 

    1.what is the reason for random random movement of code flow ,when we use "step into"  option in the code with breakpoint? and how to resolve this issue?

    Regards,

    mani

  • Hi, Mani:

    Can you start a new e2e thread for this new issue? 

    Best,

    Zigang

  • hi zigang,

    thanks for your reply.

    as you suggested ,i have created new thread.

    regards,

    mani

  • HI, Mani:

    Thank you, I am closing this e2e thread.  

    Best,

    Zigang