


Tool/software:
Recently, I have been performing some post processing on raw IQ data which I have captured with my AWR1843BOOST sensor.
Whilst I have managed to properly load the data, which I have verified by comparing my raw IQ and range-Doppler plots to those in mmWave Studio’s post-processing, I struggle a bit with AoA estimation and frankly need your help, as I am not sure how a proper AoA signal chain should be designed.
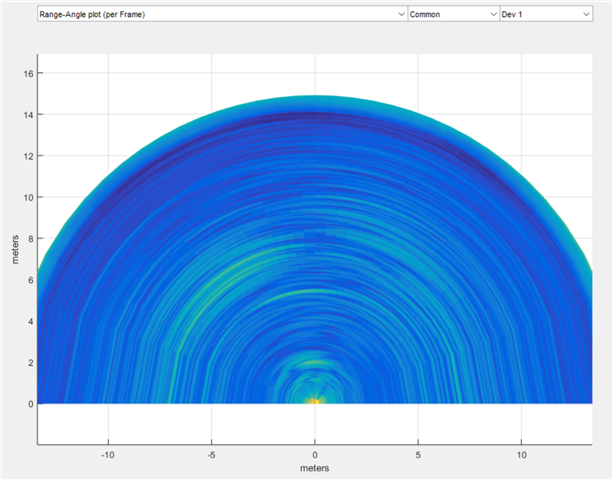
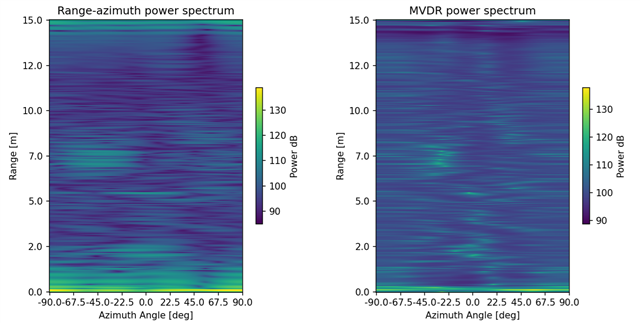
First of all, let's compare the complete range-angle plots. My plots look similar to the plot created by mmWave Studio, with my MVDR plot having (as expected) better resolution.
Where I struggle is calculating the AoA for detected targets. First I run CA-CFAR on my range-doppler map and get a list of targets (range_bin, doppler_bin). Next I feed the detections into two functions target_aoa_mvdr(...) and target_aoa_angle_fft(...). The questions I have concerning both of these functions are:
- Input data type: Should the input to my per target AoA calculation be raw iq_data or rather range_doppler? As per Wikipedia: "Delay and sum beamforming is a time domain approach. It is simple to implement, but it may poorly estimate direction of arrival (DOA). The solution to this is a frequency domain approach." Based on this, range-doppler data might seem more appropriate. However, from TI's intro videos, I understood that raw iq_data is the way to go. Which is correct?
- Input data shape: Should the input data consist of only the data at the detection coordinates (, i.e. have a shape of (N_rx, )? Or rather should all the chirps at the detection range_bin be taken (, i.e. have a shape of (N_rx, N_chirps), thus yielding a more reliable covariance matrix Rxx.
- Resolving multiple targets: For a single detected target, the AoA algorithm should be able to return more than a single angle. Thus resolving the ambiguity problem, i.e different targets at same range & v_rel but different AoA. What sort of algorithm should be used to decide whether there is a single target at or more present in the angle-FFT power spectrum? Would something like a 1D CA-CFAR work?
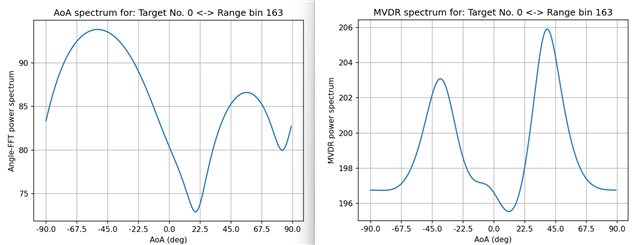
Please take a look at the AoA plots that I have produced for a detected target. I am unsure why the peaks have seemingly switched sides, and the peak locations seem to have shifted slightly. If you have any ideas, I’d be happy to know.
Here is the code section that I used to generate these plots:
def target_aoa_angle_fft(targets, frame_OI, raw_fft_range_doppler):
    """
    :param targets: List of tuples designating CA-CFAR detections [(T1_rb, T1_vb),(T2_rb, T2_vb),...]
    :param frame_OI: Designates the frame of interest
    :param raw_fft_range_doppler: Output of the range-doppler calculation. Shifted but no abs values taken.
    """
    range_bins, vel_bins = zip(*targets)
    n_targets = len(range_bins)
    angles_out = np.zeros(n_targets, dtype=float)
    padding_size = int(90 - N_rx / 2)

    for i, (r_bin, d_bin) in enumerate(zip(range_bins, vel_bins)):
        # snapshot_iq = iq_data[frame_OI, :, d_bin, r_bin]  # shape (N_rx,)
        snapshot_rd = raw_fft_range_doppler[d_bin, r_bin, :]  # shape (N_rx,)

        # Choose appropriate
        snapshot = snapshot_rd

        # Pad across the rx dim
        snapshot_padded = np.pad(snapshot, pad_width=[(padding_size, padding_size + 1)], mode='constant')

        # Perform angle fft
        angle_fft_shifted = np.fft.fftshift(np.fft.fft(snapshot_padded, axis=0), axes=0)
        angle_power = np.abs(angle_fft_shifted) ** 2
        angle_power_dB = 10 * np.log10(angle_power + 1e-12)

        detection_angles = np.argmax(angle_power_dB)
        angles_out[i] = detection_angles

        plt.figure()
        plt.plot(angle_power_dB)
        plt.xlabel('AoA (deg)')
        plt.ylabel('Angle-FFT power spectrum')
        plt.title(f"AoA spectrum for: Target No. {i} <-> Range bin {range_bins[0]}")
        plt.xticks(angle_tick_positions, angle_tick_labels)
        plt.grid()
        plt.show(block=False)

    return angles_out


def target_aoa_mvdr(targets, frame_OI, raw_fft_range_doppler):
    range_bins, vel_bins = zip(*targets)
    n_targets = len(range_bins)
    steering_array = compute_steering_vector(num_ant=N_rx, angle_res=1.0, angle_rng=90.0) # shape (N_angles, N_rx) Now (181, 4)
    angles_out = np.zeros(n_targets, dtype=float)

    for i, (r_bin, d_bin) in enumerate(zip(range_bins, vel_bins)):
        snapshot_iq = iq_data[frame_OI, :, d_bin, r_bin]  # shape (N_rx,)
        snapshot_rd = raw_fft_range_doppler[d_bin, r_bin, :]  # shape (N_rx,)

        snapshot_bins_iq = iq_data[frame_OI, :, :, r_bin]  # shape (N_rx, N_chirps)
        snapshot_bins_rd = raw_fft_range_doppler[:, r_bin, :].T  # shape before transposition (N_chirps, N_rx)

        # Select appropriate
        input_data = snapshot_bins_rd

        # Compute MVDR spectrum for targets range bin (or coordinates (,i.e. range_bin, vel_bin)???)
        mvdr_spectrum = np.zeros(steering_array.shape[0], dtype='complex')

        Rxx = input_data @ np.conj(input_data).T
        Rxx_fb = forward_backward_avg(Rxx)
        Rxx_inv = np.linalg.inv(Rxx_fb + 1e-9 * np.eye(N_rx))

        for angle_idx in range(steering_array.shape[0]):
            s_vector = steering_array[angle_idx, :]
            power_mvdr = np.reciprocal(s_vector.conj().T @ Rxx_inv @ s_vector)
            mvdr_spectrum[angle_idx] = power_mvdr

        # Convert the MVDR spectrum to dB
        mvdr_spectrum_power = np.abs(mvdr_spectrum) ** 2
        mvdr_spectrum_dB = 10 * np.log10(mvdr_spectrum_power + 1e-12)

        plt.figure()
        plt.plot(mvdr_spectrum_dB)
        plt.xlabel('AoA (deg)')
        plt.ylabel('MVDR power spectrum')
        plt.title(f"MVDR spectrum for: Target No. {i} <-> Range bin {range_bins[0]}")
        plt.xticks(angle_tick_positions, angle_tick_labels)
        plt.grid()
        plt.show(block=False)

    return angles_out
