Tool/software:
SDK version 4,4
I ported the tdmdemo to a ccs project.When I run project and want to get adcdata by debug mode,some thing strange happen:
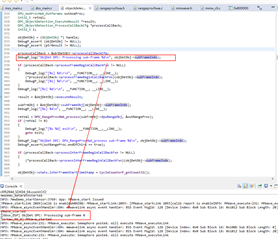
It seems that there is a problem inside the DPC_ObjectDetection_execute interface of the DSP. After the log on Line 937 is output, the subsequent log is gone, and the DSP core will not run in the future, but the CCS shows that the DSP is still running. Status.
I also hit a breakpoint to see that the two member callback functions of processCallBack are also null pointers, which do not match expectations. If you continue to debug in a single step at the breakpoint, you will directly exit the current call stack, which looks like the stack has completely collapsed. Except for printing other code without modification, the compiled appimage is also running normally.
What might be the cause of the problem?