This thread has been locked.

If you have a related question, please click the "Ask a related question" button in the top right corner. The newly created question will be automatically linked to this question.

AWRL6844EVM: Signal strength in Low Power visualizer

Part Number: AWRL6844EVM
Other Parts Discussed in Thread: AWR6843, AWRL6844

Tool/software:

Hi Ti experts,

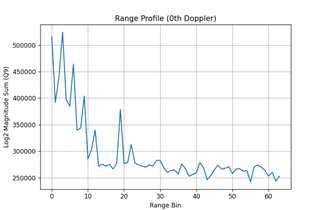
I am currently using the AWRL6844EVM for measurements and operating through the Low Power Visualizer interface.
However, I noticed that the signal strength value in the Range Profile is extremely high.
How is this number obtained?
What is the calculation method behind it?
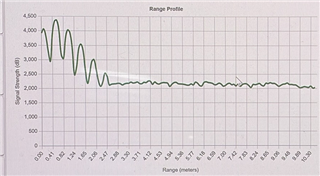

BR,
Vincent

  • Hi, Vincent:

    You are right.  The range profile looks more like in linear unit than in dB.   Let me check and get back to you to confirm. 

    Best,

    Zigang

  • Hi Zigang,

    Thanks for your reply~
    In addition, I would like to ask whether this visualizer provides any code-related resources.
    I’m looking for a way to capture the values of this curve through a computer.
    Alternatively, do you have any suggestions on how I could achieve this?

    BR,
    Vincent

  • HI, Vincent:

    In the OOB demo, the range profile is computed in linear.   

    I have re-assigned this ticket to our python visualizer expert.  He will check the format in the visualizer and get back to you in a day. 

    Best,

    Zigang

  • Hi Zigang,

    Thank you for your help.
    In addition, I would like to know if this Visualizer provides any relevant source code for our reference, or is it currently only available in the form of an executable (.exe)?
    I’m hoping to extract the range profile data using this program—do you have any alternative methods you could suggest?

    BR,
    Vincent

  • Hi Vincent,

    I am sorry for the delay, I need more time to get back to you. I am afraid we won't be able to give you the code exactly but I can outline the calculation that is done. Thank you for your patience, I will get back to you by the end of this week.

    Best,

    Vignesh K.

  • Hi Vignesh,

    Thank you for the explanation.
    It would be great if you could also provide a brief overview of the calculation process.
    By the way, may I ask when the updated version of the visualizer will be available?

    BR,
    vincent

  • Hi Vincent,

    Thank you so much for your patience, I sincerely apologize for the wait. 

    After doing some digging, the graph that you posted should say the y-axis is linear and not dB. 

    Overview of how this is plotted:

    1. TLV of Type( MMWDEMO_OUTPUT_MSG_RANGE_PROFILE, # is 3) is detected

    2. Parsing:

                 numRangeBins = length of TLV // 2

                 points = an array length of numRangeBins where each point is stored respectively to the range bin

    3. Find the peaks:

                 use the find_peaks function from scipy.signal library to find the index, heights. 

    4. Graph this as is over the indexes

    Does this answer your question? I apologize for not being able to give you the exact code as its not available to public as of now.

    We have a python GUI that is available to the public on Radar Toolbox, which contains code for other range profile calculations but not for the AWRL6884 yet.

    Best,

    Vignesh K.

  • Hi Vignesh,

    Thank you for your detailed reply.
    May I ask if I can directly convert the value to dB using the 10log() method?
    Also, how is this value calculated? Is there any related documentation available?
    I have a document on UART and TLV, but it seems to only cover the 6843.
    Is there an updated version that includes the 6844 which you could share with us?


    BR,
    Vincent

  • Hi Vignesh,

    I obtained the Range Profile values by parsing the TLV data, but I found that the values are extremely large — even after dividing by 512, they still don’t seem reasonable.
    However, the overall trend appears to be correct.
    Should these values be properly converted or scaled? I would appreciate your clarification.


    BR,
    Vincent

  • Hey Vincent,

    Vignesh is currently out and will by next week. I have commented on a few of your questions below.

    May I ask if I can directly convert the value to dB using the 10log() method?

    You should be able to directly convert the value to dB using 10log. I will confirm this with Vignesh once he gets back.

    I have a document on UART and TLV, but it seems to only cover the 6843.
    Is there an updated version that includes the 6844 which you could share with us?

    If you are using Radar Toolbox 3.10.0.05, then the Understanding UART Data Output Format document should also denote what TLVs are also available in MMWAVE-L-SDK6 which supports 6844.

    Should these values be properly converted or scaled? I would appreciate your clarification.

    I'll need to double check on this, but I believe converting to dB using 10log should help clear up the trend here.

    Regards,

    Kristien

  • Hi Kristien,

    I used the AWR6843 chip and compared the results obtained from mmWave Visualizer and TLV data. I found that although the data trends are similar, there is a significant difference in their values.

    I have two questions:

    1. I applied 10*log() to the TLV values, but the results still differ from those shown in the Visualizer. Was there any additional conversion applied between the two?

    2. I noticed that the lengths of the data are different — the Visualizer outputs 256 values, while the TLV data only contains 128. How should I interpret this discrepancy?


    BR,
    Vincent

  • Hi Vincent,

    The plotting of AWR6843 is different than AWRL6844 as the AWR6843 device is plotted after 20*log(point) is applied. Although this does not explain the difference, I thought to mention it.

    Which visualizer are you working with? If you are using the Python visualizer, you can see the calculations being done in the common/parseTLVs.py, common/Demo_classes out_of_box_x843 and common/Common_Tabs/plot_1d.py. The update1DGraph function in plot_1d.py shows how the calculations are done.

    Best,

    Vignesh K.

  • Hi Vignesh,

    I’m using version 3.6.0 of mmWave Visualizer, and I noticed that others have asked similar questions:
    IWR6843ISK-ODS: How to calcurate "Relative Power"? - Sensors forum - Sensors - TI E2E support forums
    However, when I tried to calculate it based on the method described there, the result was not as expected. For example, the TLV value 274665346 could not be converted to approximately 100.5.

    Additionally, I found that even after applying 20*log() to the TLV values, the amplitude variations were not as significant as those shown in mmWave Visualizer.
    What would be the recommended way to perform this conversion? Could you please provide a complete conversion process for our reference?

    Thank you~

     BR,
    Vincent