This thread has been locked.

If you have a related question, please click the "Ask a related question" button in the top right corner. The newly created question will be automatically linked to this question.

AWR2944EVM: mmWave Studio set-up same with Demo Visualizer

Genius 17425 points
Part Number: AWR2944EVM

Tool/software:

Hi Experts,

We'd like to ask assistance on this query from customer using AWR2944EVM:

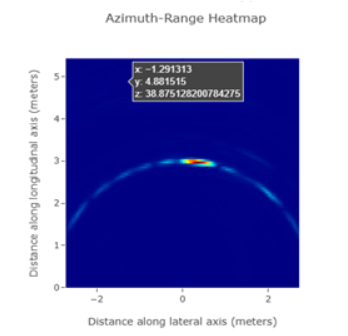
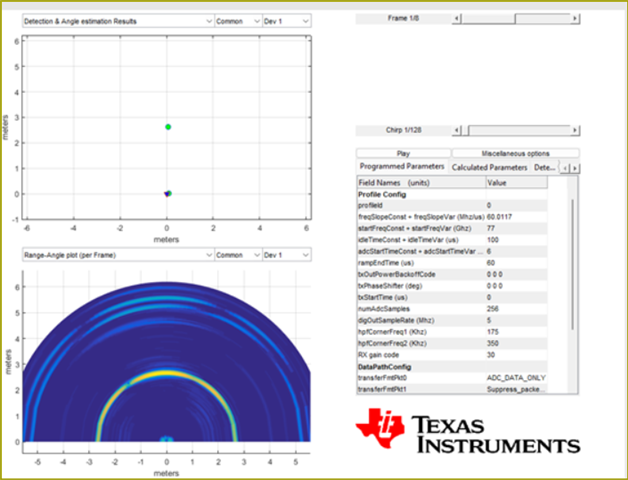
My question is about the AWR2944EVM radar board. I've tested it with the Demo Visualizer and observed quite good azimuth resolution. The Range-Azimuth HeatMap clearly shows an object detected in the correct position, as seen in this image:

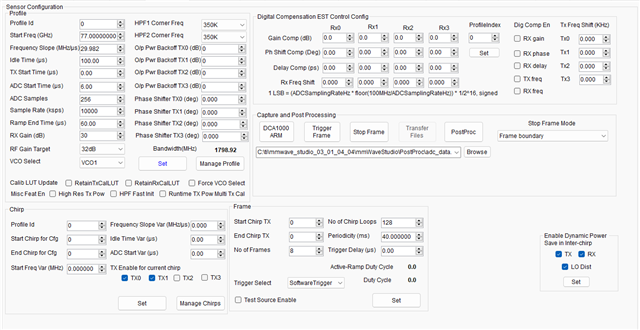
However, I've tried to achieve similar results using mmWave Studio, also connecting the DCA1000 board, but the azimuth resolution is practically nonexistent. The radar doesn't distinguish between two objects at the same distance, even if they are separated by a fairly large angle (around 60 degrees or more). As shown in this other photo , when an object is placed directly in front of the radar, it occupies a semicircle in the Range-Angle Plot of mmWave Studio, instead of yielding a result similar to the first example.


...
Could you please advise me on which parameters I need to change in mmWave Studio, or what other method I can use to achieve a similar result to the one obtained with the Demo's graph? My goal is to improve the radar's azimuth resolution.

Looking forward to your response, thank you very much.

Regards,
Archie A.

  • Hello,

    As a first step could you ensure that the sensorConfig tab on studio is populated with the same parameters as those in the profile used for your OOB example.

    Best,

    Gabriel

  • HI Gabriel,

    Thank you for your support. Cx responded:

    The configuration I used in mmWave Studio is not exactly the same as the one I used in the Demo Visualizer. However, I believe that the settings I selected in the Sensor Config tab should not affect the angular resolution. The parameters I used for the photo test in mmWave Studio are as follows: Slope = 60 MHz/μs, ADC Samples = 256, Ramp End Duration = 60 μs, Sample Rate = 5 MHz, and I also enabled all 4 transmit antennas in "TX enable for current chirp". The rest of the parameters were left at their default values (idle time = 100 μs, ADC start time = 6 μs, ...).
    On the other hand, the configuration I used for the test with the Demo Visualizer was the default configuration, selecting the "Best Range Resolution" option and the 4Rx, 4Tx antenna setting.
    73,
    Archie A.
  • Hello,

    Please give me a few days and I will check and get back with you. In the meantime can you please provide screenshots of the config they are using on the visualizer because it does not sound like they were using a pre-made profile. For example show what they used on this page.

    Please do the same for studio so I can recreate the issue as close as possible. I believe there might be some setting issue at the moment.

    Best,

    Gabriel

  • Hi Gabriel,

    Responded:

    I am sending you the configuration I used in DemoVisualizer and the configuration I used in mmWave Studio. In mmWave Studio, I only changed a few parameters in these three configuration tabs; I left the others with their default settings. (I only used one profile ID for the chirps.) The test was carried out in an anechoic chamber with a radar target placed in front of the radar.

    I don't understand why I am getting a much worse azimuth angle estimation in mmWave Studio. I hope you can help me. Thank you.

    Thank you.

    73,
    Archie A.

  • Hello,

    Thank you for the info. I will investigate and get back with you by the end of the week.

    Best,

    Gabriel

  • Hello,

    A few things.

    You did not send your sensor config tab so I cannot verify that configuration used in the visualizer was properly loaded. Please send that for me. Also I converted the configuration used on the visualizer into a .cfg file for easier usage.

    profile_studio_test.cfg

    Also in the meantime in the postproc window can you access the "Miscellaneous options" button and the in the FFT processing window play around with these choices and see if that improves anything

    In the meantime I am contacting someone more familiar with the PostProc on studio to get their input.

    Best,

    Gabriel

  • Hello,

    I consulted someone and it appears that by default postProc assumes that the antenna design is linear. The 2944EVM is slightly different and thus is why you are seeing these issues on studio. I tried seeing if there was a way to fix this but unfortunately this just seems to be a limitation of studio.

    Best,

    Gabriel

  • Hi Gabriel,

    Thanks for your help. Sorry for opening this thread again.

    Knowing that PostProc has that limitation, how can I get better results? I'm looking to obtain a heatmap similar to DemoVisualizer's Range-Azimuth Heatmap, but with a greater range (as that heatmap in DemoVisualizer only reaches up to 5 meters on the longitudinal axis).
    The Range-Angle Plot in mmWave Studio seemed like a good idea, but I wasn't aware of that limitation in the studio. Is there a way to get a similar graph to either of these with good angular resolution and a greater range?

    Thank you.

    Regards,
    Archie A.

  • Hello,

    The range of the heatmap is contingent on the configuration you provide it. Just change the range of the configuration you are sending it and you should see that said range reflected on the heatmap.

    Best,

    Gabriel

  • Hi Gabriel,

    Good day.

    Could you guide exactly which parameter in the .cfg file we need to change to adjust the range of the range-azimuth heatmap?
    Tried several changes, but none modified that 5-meter limit in the graph. However, we're able to obtain the range profile for a greater distance.
    Thank you.
    73,
    Archie A.
  • Hello,

    The range-azimuth heat map is quite a large load to send for the 2944. It is very likely it is only available to be displayed when the performance settings are very low. This plot will not be viable to display at greater performance than what you have seen it work at. That is why it is primarily grayed out on the visualizer.

    Best,

    Gabriel