


Tool/software:
Hello,
As part of my evaluation process, I am comparing the performance of the IWR6843AOP radar in two configurations:
-
As a standalone unit (connected directly to a PC and visualized via the TI GUI)
-
As part of our integrated D3 package, mounted on our drone and interfaced via CAN bus.
Test setup:
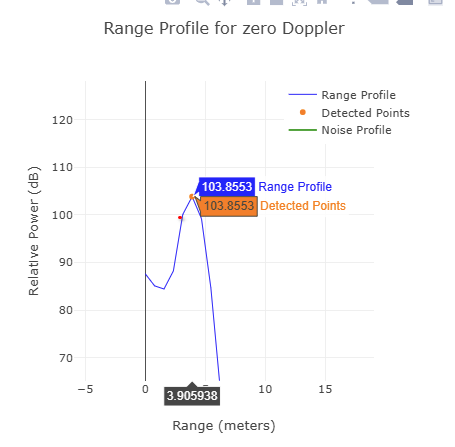
In an isolated room (anechoic chamber), I measured an 18 dBsm corner reflector and observed:
-
In the TI GUI (standalone setup): Relative power = ~104 dB
-
In the D3 package via CAN bus (side‑info TLV):
-
snr_db= 280 -
noise_db= 642
-
My Questions:
Q1:
Assuming snr_db and noise_db are in 0.1 dB units, the total signal power would be:
SNR + Noise = 28.0 dB + 64.2 dB = 92.2 dB
Is that correct?
Q2:
What exactly is the "Relative Power (dB)" shown in the TI GUI?
How can I derive it from raw TLV data or side-info fields?
Q3:
What is the relationship between the "relative power" in the GUI and the side‑info (snr_db, noise_db)?
How can I compare the standalone radar output to the CAN-based side‑info values from the integrated system?
Q4:
A total signal power of ~92 dB from a 20 dBsm corner reflector seems high.
Is there any known scaling factor, offset, or gain added to the signal in TI’s signal chain or visualization tools?
My overall goal is to use the chamber setup to measure the RCS of various real-world targets and understand their detectability with the IWR6843AOP.
Thanks in advance for your support.


