This thread has been locked.

If you have a related question, please click the "Ask a related question" button in the top right corner. The newly created question will be automatically linked to this question.

AWR2944: RX saturation monitoring

Part Number: AWR2944

Tool/software:

Hi expert,


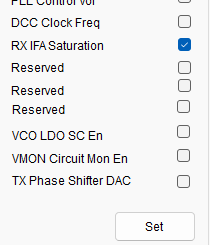
Regarding the harmonic issue in AWR2944, we want to know whether saturation has occurred at the RX analog side.

Therefore, we reviewed two documents — “MMWAVE MCUPLUS SDK User Guide” and” mmWave Radar Interface Control Document”— in the SDK mmwave_mcuplus_sdk_04_04_01_02.

But I’m not sure whether TI supports Rx saturation monitoring because the statements in the two documents are inconsistent.

So I would like to confirm with you whether the AWR2944 supports RX saturation monitoring.


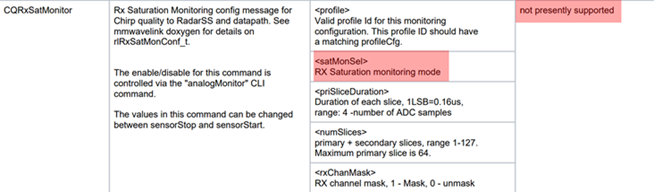
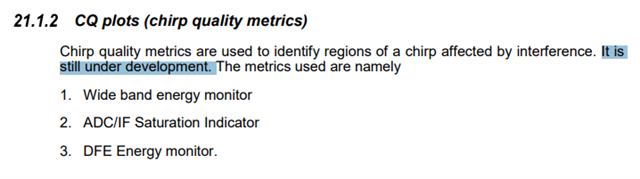
In the document “MMWAVE MCUPLUS SDK User Guide”, it is mentioned that RX saturation monitoring is currently not supported.


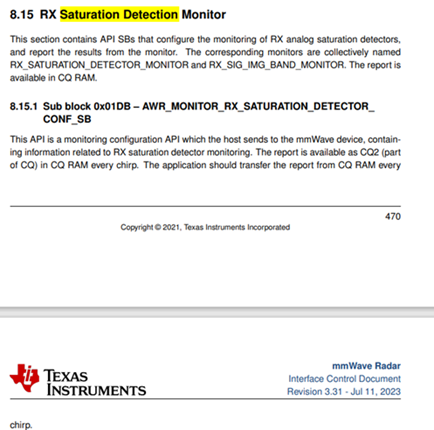
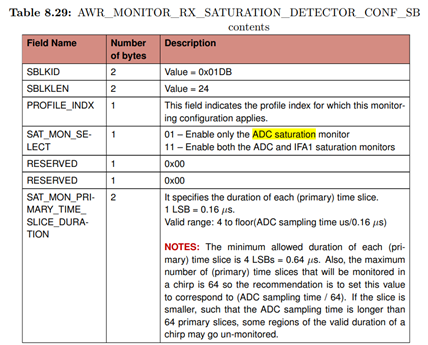
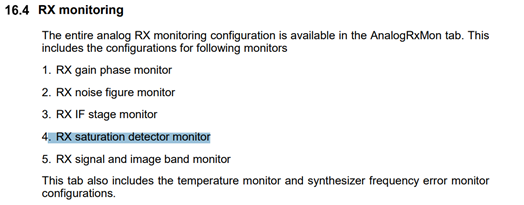
However, in another document, “mmWave Radar Interface Control Document”, there is no mention of it being unsupported.

  • Hello,

    RX saturation monitor is supported in AWR2944. Interface control document describes APIs supported by the device's firmware. The SDK is built on top of the firmware and it may not leverage all the APIs supported by the device. If it is possible for you to connect the device to mmwave studio, you can run the RX saturation monitor from the GUI and evaluate it. 

    Regards,
    Shailesh

  • Hi,

    Thanks for your suggestion.

     I have some questions after reading mmWave Studio GUI from SDK mmwave_studio_03_01_04_04and Monitoring_Data_Format.xml.

    Based on the information below, RX saturation information can be saved as a report.txt file, right?

    In the file Monitoring_Data_Format.xml (which is the output data format of the report), I did not find any information related to RX saturation. Therefore, I am curious where the RX saturation information is actually output for us to observe.

    And based on the information below, for CQ plot, it is still under development, so currently RX saturation information is not supported for output, is that correct?

    Best regards,

    JiaQuan

  • Hi,

    I have another question. 

    I have checked the mmWave Studio GUI from SDK mmwave_studio_03_01_04_04, the MMWAVE MCUPLUS SDK User Guide, and the mmWave Radar Interface Control Document from mmwave_mcuplus_sdk_04_04_01_02, but I did not find any description related to the method or evaluation criteria used by the RX saturation monitor to determine whether the ADC and IFA are saturated. Could you clarify where this information is documented or explain this in here?

    Best regards,

    JiaQuan

  • Hi JiaQuan,

    What steps have you followed to enable the RX Saturation Monitor and CQ outputs? The monitor and the CQ output will not be enabled by default.

    Regards,
    Shailesh

  • Hi Shailesh,


    I was just reading the documentation to investigate whether it can be used and how to use it, and confirming with you. The result is as me described above: the RX Saturation Monitor information is not stored in the .txt file, and the CQ outputs are still under development.
    You mentioned "by default," so does that mean there is a way to enable the RX Saturation Monitor? If so, what is the method? Could you provide the related documents or steps?

    Best regards,

    JiaQuan

  • Hi JiaQuan, 

    Can you please try the following steps in Studio?

    Use CP_ADC_CQ format DataConfig

    Then after profile configurations are done, enable RX IFA Saturation in AnalogTxMon Tab

     ,

    Then configure the saturation monitor as per your requirements. You can refer to AWR_MONITOR_RX_SATURATION_DETECTOR_CONF_SB in Interface Control Document for explanation.

    Then you can go ahead with your measurements. The received ADC data will have the chirp parameters (CP) before the ADC data and chirp quality (CQ) data appended at the end of ADC Data in every chirp. The format of this data will be as mentioned in Interface Control Document:

    This is the only method for reading the RX saturation monitor reports.

    Regards,
    Shailesh

  • Hi Shailesh,

    I followed your instruction using the TDM demo with profile_LVDS.cfg from mmwave_mcuplus_sdk_04_02_00_01.
    The device I used is AWR2944EVM, and the test environment is in the office without any strong reflectors (CR).

    First, I would like to confirm with you whether my RX saturation configuration is correct.

    RX Saturation Configuration:

    Sat Mon select = ADC and IFA1

    Slice duration = 5 µs

    Num slice = 61 (due to ADC sampling time = 49.14 µs, calculated as 560(ADC sample)/11396k(sampling rate))

    RX channel mask = 255 (i.e., 11111111, all RX channels enabled)

    I obtained the following results. Could you please let me know how to understand the saturation indicator results?
    What result is considered as saturation?

    In addition, is the figure showing the combined results of ADC and IFA1 saturation?
    If I want to view them separately, do I need to configure and measure them individually?


    Best regards,

    JiaQuan

  • Hi JiaQuan,

    The plot is showing number of saturation events it received (capped to 255) across 127 time slices (primary and secondary). This is for all the channels combined. I am not sure if the studio post-proc works on all possible configurations for CQ2. Please consider verifying the CQ2 data in the samples received over DCA using the data format documented in interface control document. 

    Regards,
    Shailesh

  • On the second part, yes it combines the IFA and ADC saturation events. 

    Regards,
    Shailesh

  • Hi Shailesh,

    Do you mean that the plot result of CQ2 is unreliable, so you want me to parse the bin file by myself and verify the CQ2 data, right?
    But after reviewing this document you mentioned, I found that it does not provide a detailed description of the data format of the bin file output by the GUI. The data inside the bin file is a 1D array, which makes me unsure how to correctly parse the data (CP, ADC, CQ).

    So far, I have used the this code to read the bin file: binData = fread(fid, 'uint16')

    And I know that the size of binData is 4961280x1.

    I deduced that the structure should be:
    (8(CP data size)+(560(ADC sample)*4(N_rx))+336(CQ data size))*16(N_loop)*3(N_tx)*20(N_frame)*2(I and Q).
    My deduction matches the binData size. All the values above come from my configuration, except the factor of 2 (I and Q), which I am not sure.
    Is my deduction correct?

    The reason I suspect it is (I and Q) is because in the content of binData, the values at even indices are all zeros, which makes me think that it is Q part.

    However, I am still doubtful about the (I and Q), because in the GUI I configured it as follows:


    Best regards,

    JiaQuan


  • Hi JiaQuan, 

    The AWR2944 device will give only I data and not I and Q, so that factor should be removed. I don't think you should get the extra 0s that you are seeing. Otherwise, your data format understanding looks correct. Does the ADC data part make sense once you ignore the 0s? 

    Then to confirm if CQ data is coming correctly, we should try to see the 'N' number of slices value in the beginning of the CQ data for each chirp.

    Regards,
    Shailesh

  • Hi Shailesh,
    After ignoring the 0s, I parsed the 'N' number of slices value for the first three chirps (which represents the three antennas transmitting chirps in the first loop in the first frame), and all three values are 18, which does not match my setting of 61 slices.
    Could you provide a detailed description of the data format of the bin file output by the GUI? I think this is helpful for me to parse data.

    Best regards,

    JiaQuan


  • After ignoring the 0s, are the 560 RX ADC samples making the right sense? If not then we need to look into the configurations and/or data re-arrangement for parsing. Your understanding of the structure looks correct to me: (8(CP data size)+(560(ADC sample)*4(N_rx))+336(CQ data size))*16(N_loop)*3(N_tx)*20(N_frame). 

    Regards,
    Shailesh