Other Parts Discussed in Thread: AWR6843, MMWAVEICBOOST
Tool/software:
Dear sir/madam
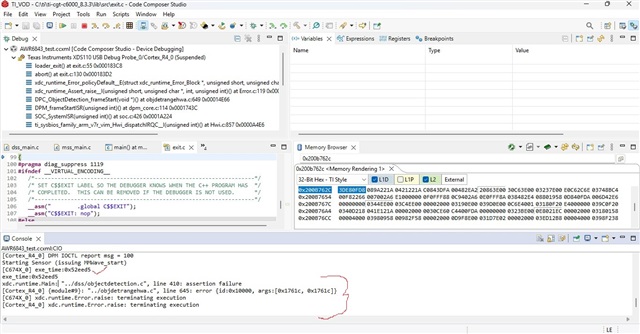
we are using AWR6843ISk + mmwave booseter setup . and able to run the "AWR6843_CPD_with_Classification" example project on debug mode on code composure studio .
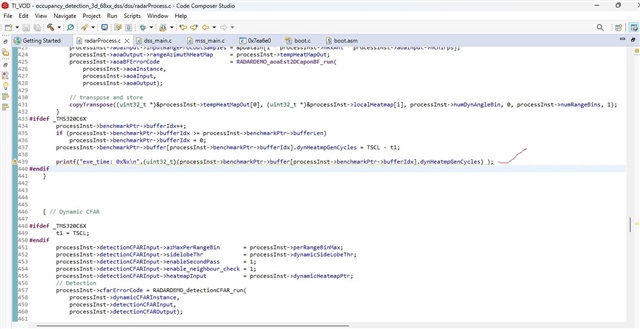
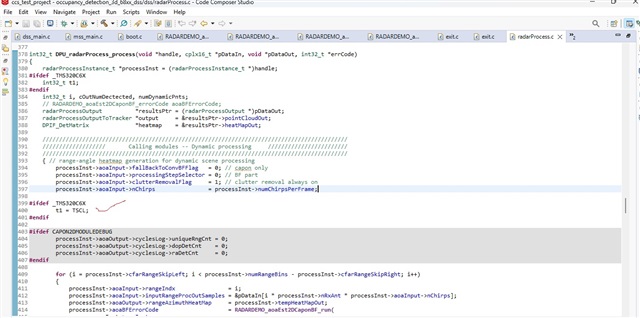
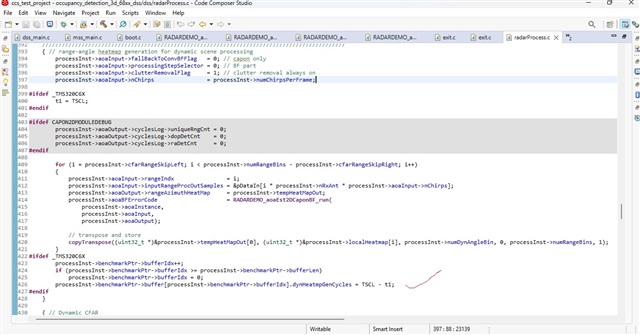
i see part of the code there is logic to estimate time taken for the logic to execute,(screenshot attached for reference)
my question:
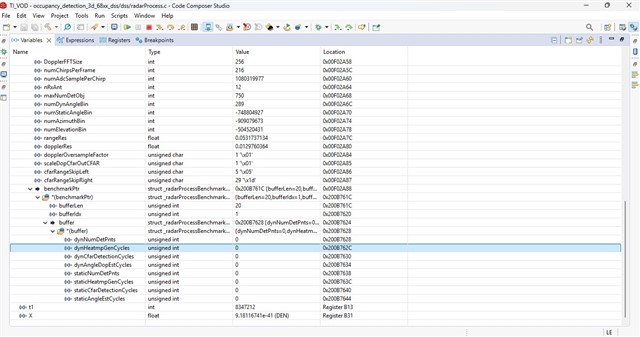
1.where i can find the estimated time value "processInst->benchmarkPtr->buffer[processInst->benchmarkPtr->bufferIdx].dynHeatmpGenCycles"?
if its get stored in this variable then how to get this value to visulaise?
2. does it stored in any log file ,if yes where can i check it?
regards,
mani