IWR6843ISK: Critical Data Port TLV Misalignment/Corruption Issue with Specific TLV Types (2, 3, 4, 5, 8) - Node.js Implementation

Part Number: IWR6843ISK


Tool/software:

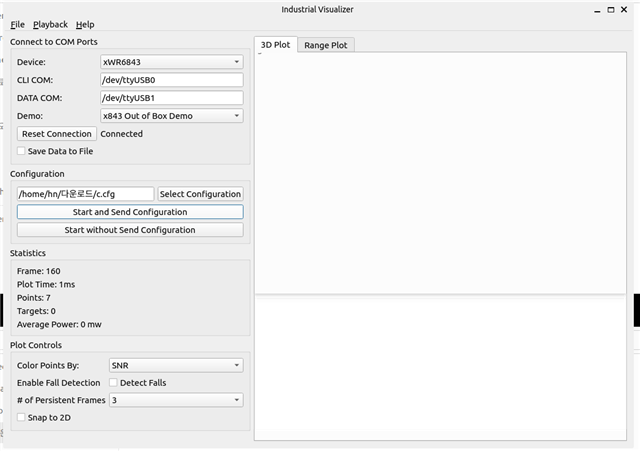
I am writing back as I have failed to resolve a critical data parsing issue despite trying standard alignment fixes. My setup uses Node.js for parsing data streamed from the Data Port based on the following configuration.

Please note: My application uses a custom Node.js parser and does not rely on any Python-based tools or GUIs from TI.

Summary of Persistent Problems:

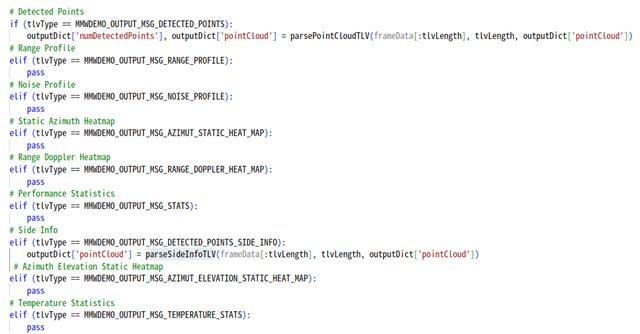
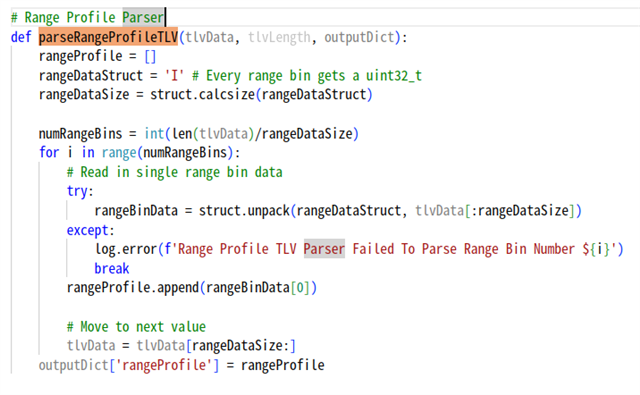
  1. TLV Chain Corruption (TLV 2 & 3):

    • TLVs 1, 6, 7, and 9 are received correctly.

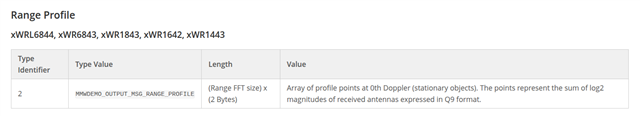
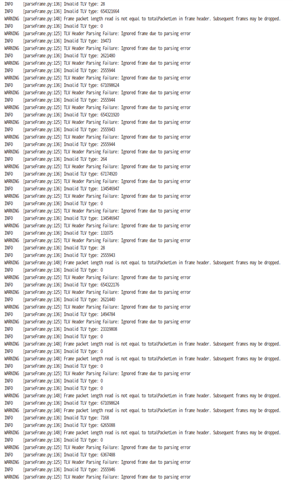
    • When TLV 2 (Range Profile) and/or TLV 3 (Noise Profile) are included (e.g., guiMonitor -1 1 1 1 0 0 1), the next TLV header (Type and Length) is always corrupted, resulting in nonsensical values (e.g., 143525728).

    • I have attempted the two most common solutions:

      • Applying 4-byte and 8-byte boundary alignment after consuming the tlv.length in the main loop (processBuffer).

      • Testing 4-byte stepping inside the parseRangeProfile and parseNoiseProfile functions (assuming 2-byte data + 2-byte padding per point).

    • All alignment solutions failed, leading me to believe the issue is deeply rooted in the protocol's definition under this specific configuration.

  2. TLV 4, 5, and 8 Transmission Failure:

    • When attempting to request TLV 4 (Azimuth Static Heatmap), 5 (Range-Doppler Heatmap), or 8 (Azimuth/Elevation Static Heatmap) by setting the corresponding guiMonitor arguments to 1, the sensor completely stops transmitting any data (including the other working TLVs).

Critical Questions:

  1. TLV 2 and 3 Data Format/Alignment:

    • Given the persistent misalignment, can you confirm the exact alignment rule for the end of the Range Profile (TLV 2) and Noise Profile (TLV 3) data blocks?

    • Is the internal structure of these TLVs strictly contiguous 2-byte data points or are the points individually padded to a 4-byte or 8-byte boundary?

  2. TLV 4, 5, and 8 Configuration Requirements:

    • Why does requesting TLV 4, 5, or 8 lead to a complete halt in data transmission?

    • Is a specific configuration command (e.g., related to adcbufCfg, BPM, or a different channelCfg) missing or incorrect in my startCommands list, which is required to enable the computation of these heatmap TLVs?

  3. When parsing the TLV header, the type and length are obtained. Does the length include the TLV header itself?

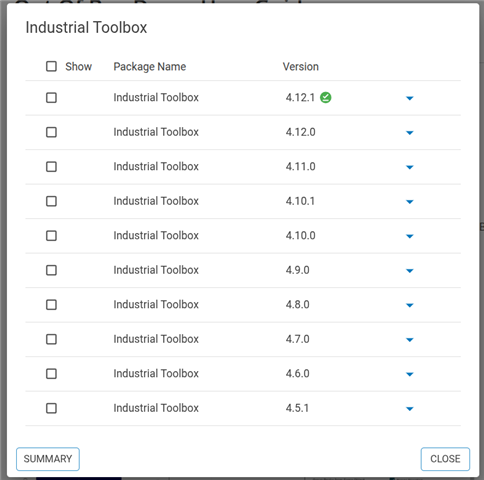
I referred to the datasheet at https://dev.ti.com/tirex/explore/node?node=A__AaagUFIod1NcG0sE-noAfw__radar_toolbox__1AslXXD__LATEST and believe I mapped it correctly, but just in case, I’m including my implementation here.

startCommands = [
'sensorStop',
'flushCfg',
'dfeDataOutputMode 1',
'channelCfg 15 5 0',
'adcCfg 2 1',
'adcbufCfg -1 0 1 1 1',
'profileCfg 0 60 567 7 57.14 0 0 70 1 256 5209 0 0 158',
'chirpCfg 0 0 0 0 0 0 0 1',
'chirpCfg 1 1 0 0 0 0 0 4',
'frameCfg 0 1 16 0 100 1 0',
'lowPower 0 0',
'guiMonitor -1 1 1 1 0 0 1',
'cfarCfg -1 0 2 8 4 3 0 15 1',
'cfarCfg -1 1 0 4 2 3 1 15 1',
'multiObjBeamForming -1 1 0.5',
'clutterRemoval -1 0',
'calibDcRangeSig -1 0 -5 8 256',
'extendedMaxVelocity -1 0',
'bpmCfg -1 0 0 1',
'lvdsStreamCfg -1 0 0 0',
'compRangeBiasAndRxChanPhase 0.0 1 0 1 0 1 0 1 0 1 0 1 0 1 0 1 0 1 0 1 0 1 0 1 0',
'measureRangeBiasAndRxChanPhase 0 1.5 0.2',
'CQRxSatMonitor 0 3 5 121 0',
'CQSigImgMonitor 0 127 4',
'analogMonitor 0 0',
'aoaFovCfg -1 -90 90 -90 90',
'cfarFovCfg -1 0 0 8.92',
'cfarFovCfg -1 1 -1 1.00',
'calibData 0 0 0',
'sensorStart'
]


// TLV type 2 - Range Profile.
function parseRangeProfile(buffer, offset, length) {
if (length % 2 !== 0) {
console.warn('TLV type 2, Range Profile length is not multiple of 2, skipping parsing')
return []
}

const numPoints = length / 2
const profile = new Array(numPoints)

for (let i = 0; i < numPoints; i++) {
const base = offset + i * 2
const raw = buffer.readUInt16LE(base)
profile[i] = raw / 512.0
}

return profile
}

// TLV type 3 - Noise Profile.
function parseNoiseProfile(buffer, offset, length) {
if (length % 2 !== 0) {
console.warn('TLV type 3, Noise Profile length is not multiple of 2, skipping parsing')
return []
}

const numPoints = length / 2
const profile = new Array(numPoints)

for (let i = 0; i < numPoints; i++) {
const base = offset + i * 2
const raw = buffer.readUInt16LE(base)
profile[i] = raw / 512.0
}

return profile
}

// TLV type 4 - Azimuth Static Heatmap.
function parseAzimuthStaticHeatmap(buffer, offset, length) {
const numRangeBins = 256
const numVirtualAntAzim = 8

if (length !== numRangeBins * numVirtualAntAzim * 4) {
console.warn('TLV type 4, Azimuth Static Heatmap length mismatch, skipping parsing')
return []
}

const heatmap = []

for (let r = 0; r < numRangeBins; r++) {
const row = []
for (let a = 0; a < numVirtualAntAzim; a++) {
const base = offset + 4 * (r * numVirtualAntAzim + a)
const imag = buffer.readInt16LE(base)
const real = buffer.readInt16LE(base + 2)
row.push({ real, imag })
}
heatmap.push(row)
}

return heatmap
}

// TLV type 5 - Range-Doppler Heatmap.
function parseRangeDopplerHeatmap(buffer, offset, length) {
const numRangeBins = 256
const numDopplerBins = 16

if (length !== numRangeBins * numDopplerBins * 2) {
console.warn('TLV type 5, Range-Doppler Heatmap length mismatch, skipping parsing')
return []
}

const heatmap = []

for (let r = 0; r < numRangeBins; r++) {
const row = []
for (let d = 0; d < numDopplerBins; d++) {
const base = offset + 2 * (r * numDopplerBins + d)
const raw = buffer.readUInt16LE(base)
row.push(raw / 512.0)
}
heatmap.push(row)
}

return heatmap
}

// TLV type 8 - Azimuth/Elevation Static Heatmap.
function parseAzimuthElevationStaticHeatmap(buffer, offset, length) {
const numRangeBins = 256
const numVirtualAntennas = 12

if (length !== numRangeBins * numVirtualAntennas * 4) {
console.warn('TLV type 8, Azimuth/Elevation Static Heatmap length mismatch, skipping parsing')
return []
}

const heatmap = []

for (let r = 0; r < numRangeBins; r++) {
const row = []
for (let a = 0; a < numVirtualAntennas; a++) {
const base = offset + 4 * (r * numVirtualAntennas + a)
const imag = buffer.readInt16LE(base)
const real = buffer.readInt16LE(base + 2)
row.push({ real, imag })
}
heatmap.push(row)
}

return heatmap
}

Thank you for providing a technical answer to these protocol-level questions.

  • If I set it to receive 1, 7, and 2 using guiMonitor -1 1 1 0 0 0 0, it works fine. But if I add anything else, the next TLV type gets corrupted, e.g., 65536. Only after 2 or 3. 
    Setting 4, 5, or 8 alone doesn’t send any data, and if combined, they prevent the others from sending data as well.
  • Hello, 

    Please give us another day or two to reply on this topic. Thanks for your patience. 

    Best regards,

    Josh

  • I appreciate your hard work. I have learned some additional facts from another answer, and I would appreciate it if you could also refer to this:

    https://e2e.ti.com/support/sensors-group/sensors/f/sensors-forum/1571172/iwr6843isk-issue-with-tlv-2-3-causing-subsequent-tlv-parsing-corruption/6053053

    Since there is no edit function for my earlier post, and because I was pressed for time with my project schedule, I hastily submitted another question. As a result, I am now receiving answers in two different places, for which I apologize.

  • I’m not sure about 4, 5, and 8, but regarding 2 and 3, I think it might just be due to the amount of data in the packets. Yesterday, it worked fine when I selected 1, 7, 6, and 9. However, today the same settings sometimes cause errors. I noticed this by observing the logs. The difference from yesterday is that the number of detected objects has increased.

    If the increase in detected objects leads to larger packets and occasionally causes errors, it seems understandable that TLV 2 and 3, which transmit a lot of data, could consistently trigger errors. Could occasional packet corruption be unavoidable in this case? Of course, if proper exception handling is implemented to ignore these errors, it shouldn’t be a major problem, since the next cycle will bring updated packets anyway.
  • Hi,

    Which demo are you using? Did you specify enough frame time to transmit all the necessary data?  There's a python visualizer which handles all the parsing of TLVs. The source code is present in the radar toolbox, so please have a look into it. I would first suggest you to use the python visualizer source to log the data and if everything is okay, then you can shift back to your node parser. In this way, we can isolate whether the issue is in your parsing or the actual demo.

    Regards

  • Hi. I applied the same configuration as mentioned in this answer:
     RE: IWR6843ISK: Issue with TLV 2/3 Causing Subsequent TLV Parsing Corruption 

    Then, is this correct configuration? Things like the frame configuration you mentioned.

    The result is not good. Even when I select the Profile and Map, sometimes it looks like all the data is displayed correctly. But it happens rarely, which I think means that when Profile and Map are selected, proper parsing occurs only occasionally, causing the updates to freeze frequently. When I shake the sensor, the coordinates are updated immediately if only the Scatter Plot and Statistics are selected, but not when Profile and Map are included.

    I looked for the Python code you mentioned, but I couldn’t find it. Where is it located? I searched in <MMWAVE_SDK_03_06_02_00-LTS-LINUX-X86-INSTALL> that I installed. I don’t think it’s in mmwave_sdk_03_06_02_00-LTS/packages/ti/demo/parser_scripts. But since the issue still occurs in the web-based visualization demo app, I guess the results will be similar even if I run it using the Python code.

    We recently ordered a new board, which was supposed to come pre-configured. I tested it, and the results were similar. If it’s not a frame configuration issue, could it really be a cable problem? Hmm.

  • Hello,

    Please look at the python source code present in the radar toolbox. You need to first install radar toolbox online and then you can navigate to this folder
    {TOOLBOX_DIR{\tools\visualizers\Applications_Visualizer to view the source code.

  • Hi, I don't know where the path you mentioned is.

    I have searched here based on this answer:

    https://e2e.ti.com/support/tools/code-composer-studio-group/ccs/f/code-composer-studio-forum/1326454/installing-radar-toolbox---code-composer-studio-version-11-1-0-00011?keyMatch=radar%20toolbox&tisearch=universal_search

    I found this page, but I don't think it's correct.

    Then, I installed industrial toolbox.

    It seems like this caused a file to appear in the path '/home/ti/mmwave_industrial_toolbox_4_12_1'

    Is this the source code that you mentioned? 

    This is the run screen.

    It passes the parsing logic, except for TLV 1 or 7.

    I think it is not correct too.

    I've searched the website using keywords like Radar, Toolbox, and SDK. I also have checked other answers. But I could not find a part that I consider accurate. My board is iWR6843ISK. Could you tell me the exact installation path and the source code path?

  • Ah, sorry. I should have looked in the 'radar toolbox', not the 'industrial toolbox'.

    Now, I found what you mentioned.

    I have three questions.

    1. 

    I found the functions corresponding to each TLV, but when I searched for their names, I could not find any places where they are called. Could you tell me the correct part where they are called?

    2.

    I found this code,

    Are 3, 4, 5, 8, 9 unused? In the demo app below, it was selectable.

    https://dev.ti.com/gallery/view/mmwave/mmWave_Demo_Visualizer/ver/3.6.0/

    How should I understand this?

    3.

    I think the Python code does not match the protocol. According to the TI Radar Toolbox documentation, TLV type 2 should be read as 2 bytes per value, but the Python code reads 4 bytes. Also, how should the Q-format scaling be applied?

    python code in /home/user/ti/radar_toolbox_3_20_00_04/tools/visualizers/Applications_Visualizer/common/parseTLVs.py

    protocol in:

    https://dev.ti.com/tirex/explore/content/radar_toolbox_3_20_00_04/software_docs/Understanding_UART_Data_Output_Format.html#detected-points

  • Hi,

    Can you try executing the demo with this industrial visualizer present in the radar toolbox first? For the size of the data, I would suggest you to correlate with whatever is present in the demo C code. 

    Regards

  • I tried it, but the result is the same. When the profile is enabled, the TLV type data comes in corrupted. If I disable the profile and only select scatter and stats, the number of corrupted TLVs decreases significantly.

    Below is the log when the profile is enabled.

    However, when I use the app, the display doesn’t render properly — though that seems unrelated; it looks more like a graphical issue.

  • Hi, Now, the problem is clearer.

    I've been using Linux so far, but I tried running the experiment on Windows.

    Unlike Linux, Winodws does not have CP210x driver preinstalled, so I installed it before proceeding.

    The result is perfect.

    What could be difference between the two?

    I checked the driver properties — data bits, parity, stop bits, and flow control — and the settings were the same on both Windows and Linux.

    Is there any part of these settings that needs to be adjusted for your obard?

  • No worries at all!

    I tested it on another Linux machine, and it works fine. It turns out the issue was actually with my own computer. I really appreciate all your patient and detailed help. Thank you so much!