This thread has been locked.

If you have a related question, please click the "Ask a related question" button in the top right corner. The newly created question will be automatically linked to this question.

TDC7200 mode 2 accuracy (deviation)?

Other Parts Discussed in Thread: TDC7200

Hi all,

I am using TDC7200EVM and MSP430F5529LP to measure TOF between two signals.

I used function generator to generate two pulses with a tof about 544ns and measured it using both mode 1 and mode 2, however mode 2 seems to have some strange results.

CLK: on board 8M clock.

Mode 1: left: tof; right: histogram; unit: ps

forceCalibration: off

CALIBRATION: 40 PERIODS

AVERAGE: 1 CYCLE
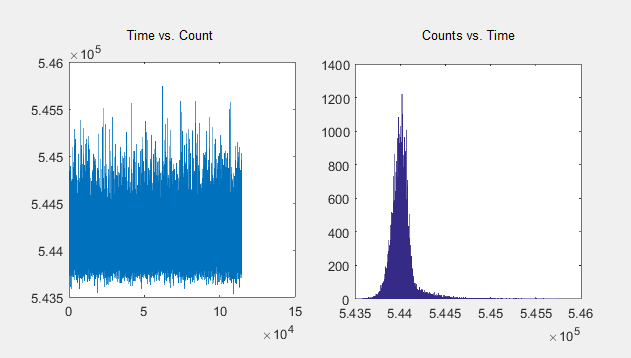
Mode 2: left: tof; right: histogram; unit: ps

forceCalibration: off

CALIBRATION: 40 PERIODS

AVERAGE: 1 CYCLE
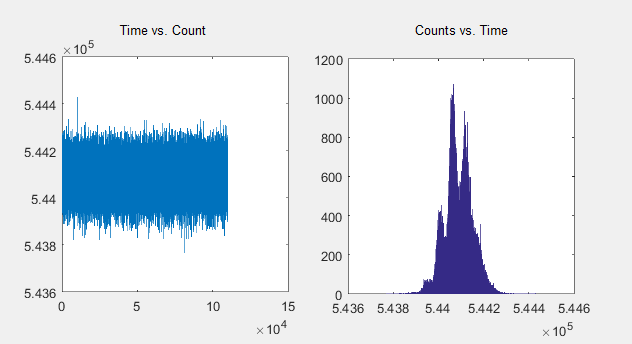
Histogram of mode 1 shows a normal distribution, however histogram of mode 2 does not. 

Is this a problem? or can anyone please explain why this happens?

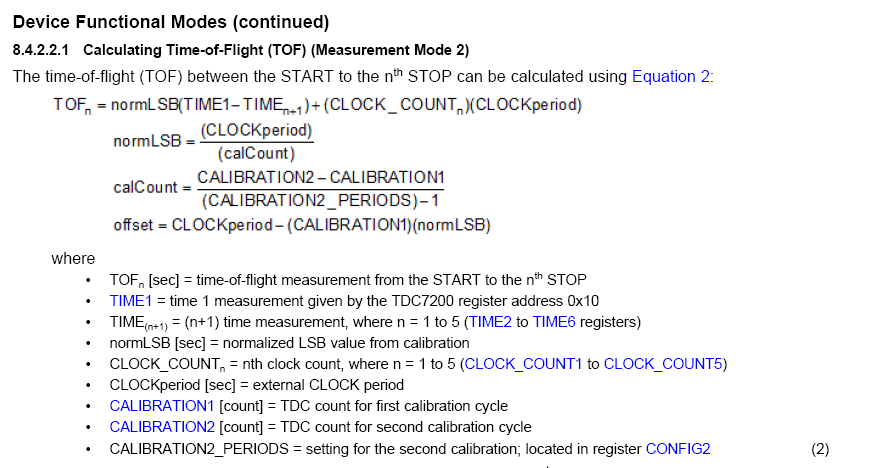
PS. What does "offset" in mode 2 mean? It seems that it has nothing to do with the TOF.
Thanks.

Eric

  • Eric,

    Both mode1 and mode2 uses the external clock as its reference to determine the internal LSB of the TDC7200. In mode1, the complete 544ns measurement is done using the internal ring oscillator. As shown in Figure 17 of the Data Sheet, as the measured time period increases, the standard deviation increases.

    Whereas in mode 2, the internal ring oscillator is used to measure only fractional part of the total measured time: start edge to first clock edge (max 125ns for 8MHz clock) and stop edge to next clock edge (max 125ns for 8MHz clock). Rest of the measurement is based on the external clock cycles. In your example, the standard deviation is definitely lesser than mode 1 (and histogram bin range is tighter), but in this case as the TOF = 544ns, a significant portion of the total measured time could still be measured/affected by internal ring oscillator which contributes to measurement deviation. I would be curious to see how the histogram varies for a measured time of 50us instead of 544ns.

    Can you also try with calibration setting as 10 cycles? You have it as 40 cycles(5us), almost 10 times the measurement period. This is again a very long measurement by the internal ring oscillator and affects the lsb accuracy.

    Note the jitter of the function generator start/stop edges also contributes to the deviation. What's the function generator manufacture/model #?

    Are you using the latest GUI/Firmware (v1.7.3.0)? Please make sure you are using the latest.

    The "offset" value gets cancelled and doesn't affect the TOF calculation. Please ignore the "offset" equation. I think there's an updated data sheet (Rev D) on the web that fixes this.

    Thanks,
    Vishy
  • Vishy,

    Thanks for your reply.

    I am using Rigol DG4162 function generator (160 MHz, 500 Msa/s)

    I am updating my project from my previous post here:

    and you suggested higher calibration2_period selection improves accuracy so I set it to 40.

    1) I am a little confused now, should I set calibration period based on the TOF of interest? and how?

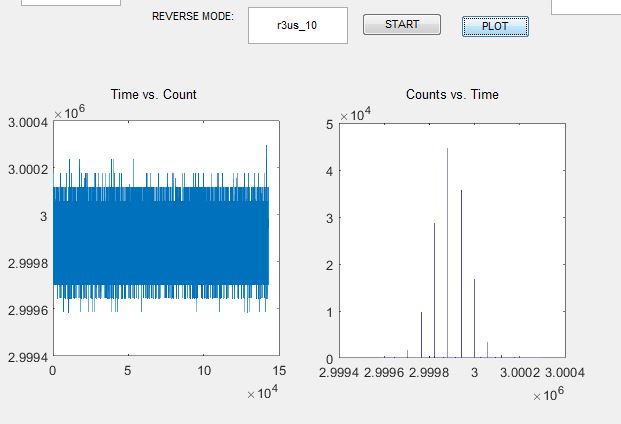
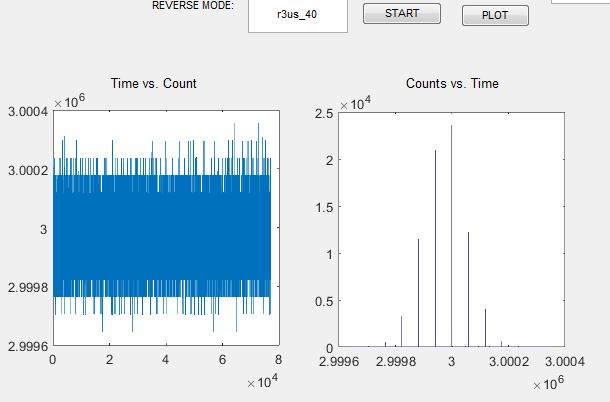
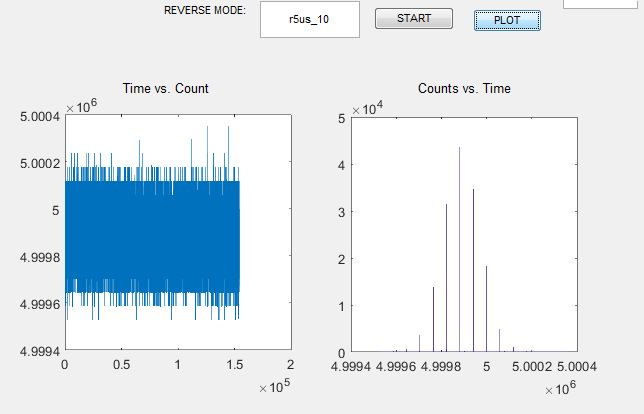
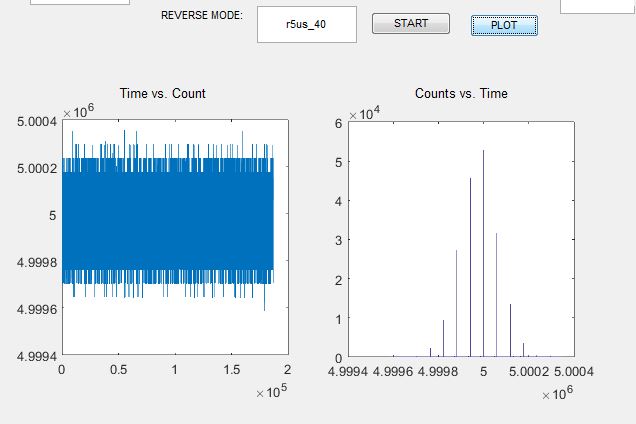
    2) I did more measurements and the results are:

    tof=1us, calibration period = 10 vs. 40

    tof=3us, calibration period = 10 vs. 40

    tof=5us, calibration period = 10 vs. 40

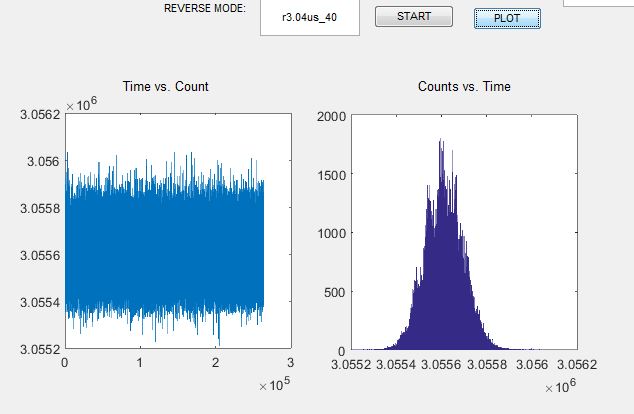
    tof=3.04us, calibration period = 10 vs. 40

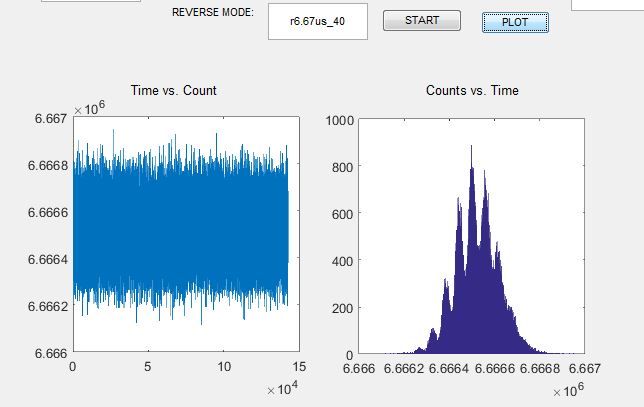
    tof=6.67us, calibration period = 10 vs. 40

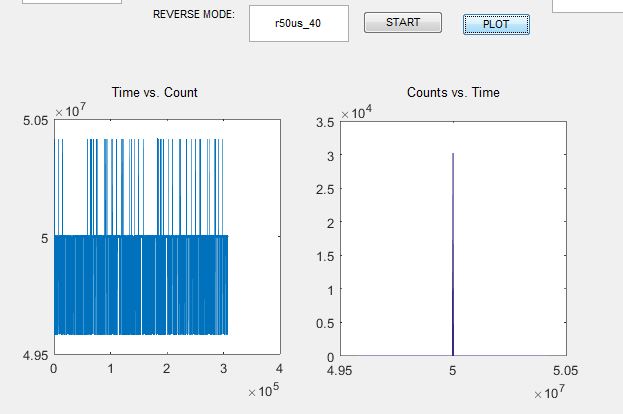
    tof=50us, calibration period = 10 vs. 40

    My guess: it seems when tof is near the range of N times of clock cycle (125 ns), the measured results "lean to" N times of clock cycle (125 ns), because I found although the values of TI_TDC7200_TIME1_REG and TI_TDC7200_TIME2_REG vary from each measurement, but the difference of TI_TDC7200_TIME1_REG and TI_TDC7200_TIME2_REG is very small (absolute value less than 10).

    When of is not near the range of N times of clock cycle (125 ns), the "leaning" effects still exist but become less significant.

    How to solve it?

    Thanks and regards,

    Eric

  • Hello Eric,

    1) Sorry about the confusion. In general, longer number of calibration cycles should decrease LSB error due to higher averaging. It’s also true, running the internal ring oscillator longer implies increased power and higher chances of error accumulation due to system level noise.   Depending on the input clock frequency and system constraints like power and throughput, you might have to balance this. For example, with 1MHz clock even 2 cycles duration is long compared against 16MHz 20 cycles. Looking at your data for 10 vs 40, I can see 40 cycles is not giving much improvement to the accuracy. For 8MHz typical clock, you are ok with 10cycles calibration. 

    2) Also, depending on your application, it might help to calibrate the 8MHz clock externally. The 8MHz oscillator may be not be exactly 8MHz and this difference might be contributing as well. Otherwise, use a calibrated high accuracy external clock generator.

    3) From the Data Sheet for RIGOL DG4162, it looks like input jitter(rms) on the start/stop pulses is 500ps typical. This can contribute a good portion of the mode 2 deviation you are seeing.

    4) Are you using the trigger input of DG4162? Connect the trigger output of TDC7200 to DG4162 trigger-in so start/stop pulses are generated following a trigger.

    5) Regarding the case when tof is closer to the range of N clock cycles (125ns), my guess is the clock count is also changing between measurements. The multiple distributions are likely due to different ClockCount results. There are 2 valid clock count results for a measurement time of 544ns at 8MHz:

    Clock Count

    Clock Count Time

    Time1

    Time2

    Result

    4

    500

    125

    81

    544

    5

    625

    0

    81

    544


    The Clock count Time provides two different offset for the distribution and the time1-time2 result produces the noise on the distribution. If the clock frequency used in the calculation differs from the real frequency, this will have a different effect on the Clock Count Time calculation than the LSB calculation.  


    6) I enclose below a histogram of 544ns run from my bench setup. I used Tektronix AFG3102 (1GS/s, 100MHz, 200ps rms jitter ) as the source for Start/Stop inputs. We don’t think this multiple distribution affects the mode 2 accuracy or standard deviation.

     histogram.tif

    Thanks,

    Vishy

  • Hi Vishy,

    Thanks for your reply. I still have some confusions.

    1) What do you mean by "calibrate the 8MHz clock externally" ? Should I use a oscilloscope to measure the real frequency of the on-board clock and use it to calculate the TOF instead of the theoretical value 125ns? 

    2) For the histogram you measured, were you using on-board clock or an external one?

    3) Could you please try to measure some TOFs closer to the range of N clock cycles (125ns) and see whether you will have the same histogram problem as mine? In my case, like you guessed, the clock count is changing, however the difference between time1 and time2 remain very small.

    Thanks,

    Eric


  • You can refer to the enclosed document below on clock calibration. Thanks.TDC7200_Question1.pdf

  • Eric,

    2) For the histogram you measured, were you using on-board clock or an external one?

    >>>On-board clock

    3) Could you please try to measure some TOFs closer to the range of N clock cycles (125ns) and see whether you will have the same histogram problem as mine? In my case, like you guessed, the clock count is changing, however the difference between time1 and time2 remain very small.

    >>>I have enclosed here a document that attempts to explain the histogram distribution.The lsb changing over temperature affects the distribution in both cases (TOF is close to a multiple of 125ns or not) as explained.

    TDC7200_LSB_Variation.pdf

    Thanks,

    Vishy

  • Hi Vishy,

    Thanks for the detailed reply.

    For the variation issue in mode 2, something still confuses me:

    I can understand your example:

    "Take two examples, in the first case, TIME1 – TIME2 is in the range -5 to +5. In the second case, TIME1 – TIME2 is 1995 to 2005. The variation in the ranges is exactly the same."

    However, in your Example 2: Mode 2, TOF = 5us, Cal Cycles = 10, 8MHz onboard clock,

    The TOF Distribution is normalized distribution because the CLK_CNT is normalized  distributed, since CLK_CNT is changing, I think instead of being in the range of -7 to 1 (as your figure shows), TIME1 – TIME2 should change with the CLK_CNT, another way to say is that TIME1 – TIME2 should be more widely distributed in a much wider range to make the tof normalized distributed, I still cannot understand why TIME1 – TIME2 lies in a such narrow range when CLK_CNT is changing.

    Regards,

    Eric

  • Eric,

    We were first thinking the multiple distributions seen is caused by CLK_CNT changing. On further analysis, we found the LSB sensitivity to temperature as the cause as explained in the document I posted. CLK_CNT changing is not the cause and for example 2, tof = 5us, I enclose below the CLK_CNT1 histogram. 

    Regards,

    Vishy

  • Vishy,
    Many thanks!
    Eric