This thread has been locked.

If you have a related question, please click the "Ask a related question" button in the top right corner. The newly created question will be automatically linked to this question.

IWR1443BOOST: IWR1443BOOST

Part Number: IWR1443BOOST

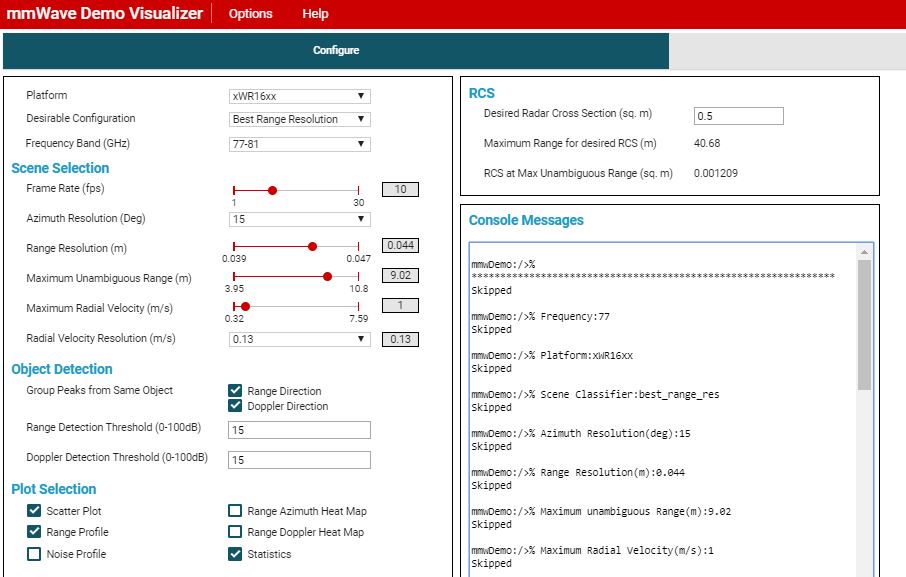
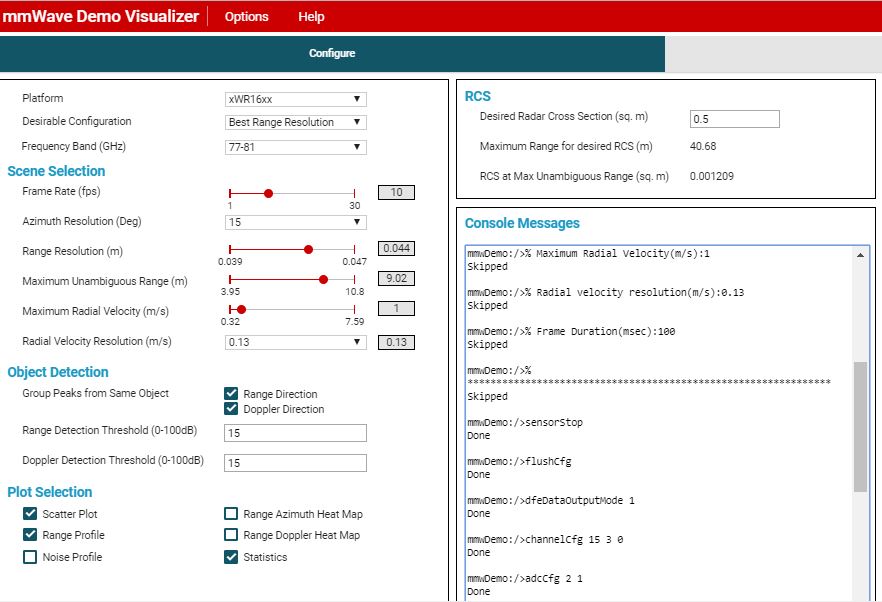
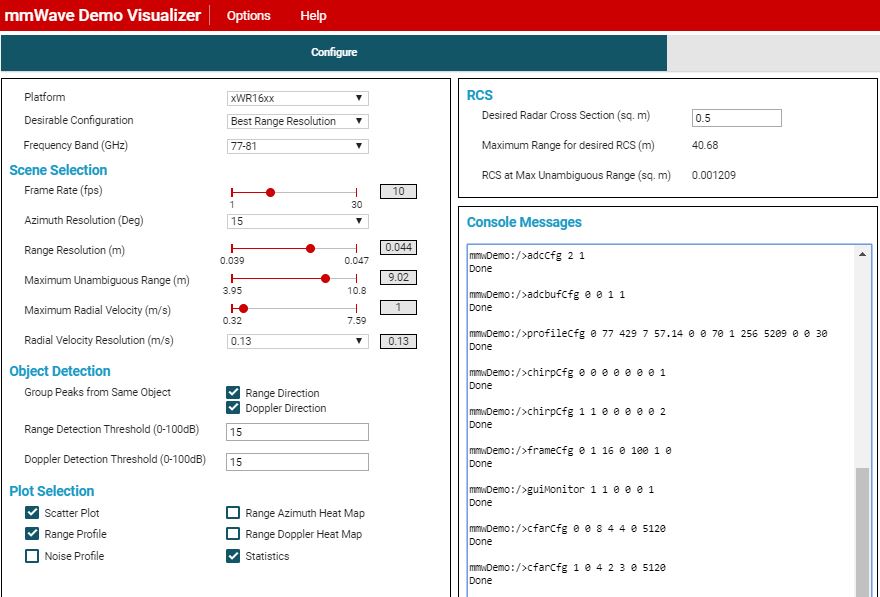
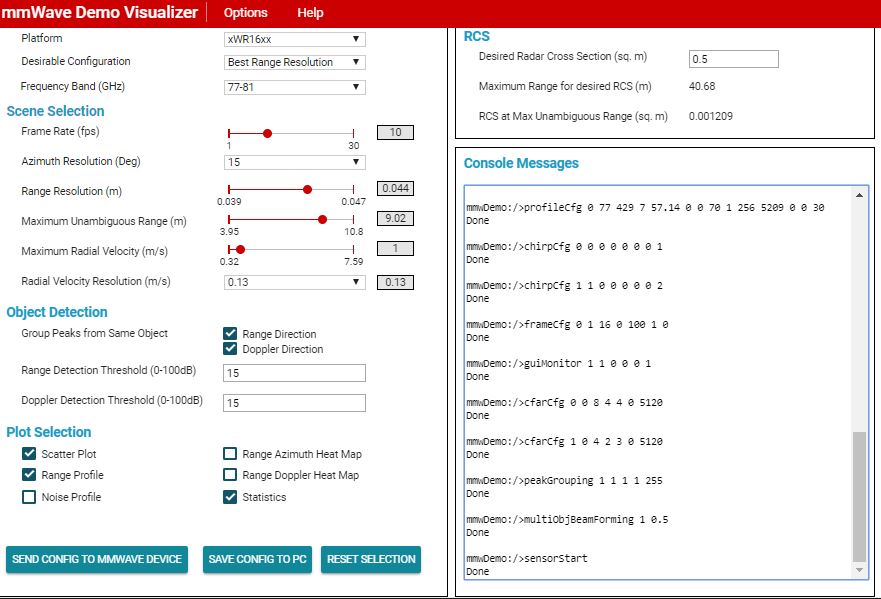
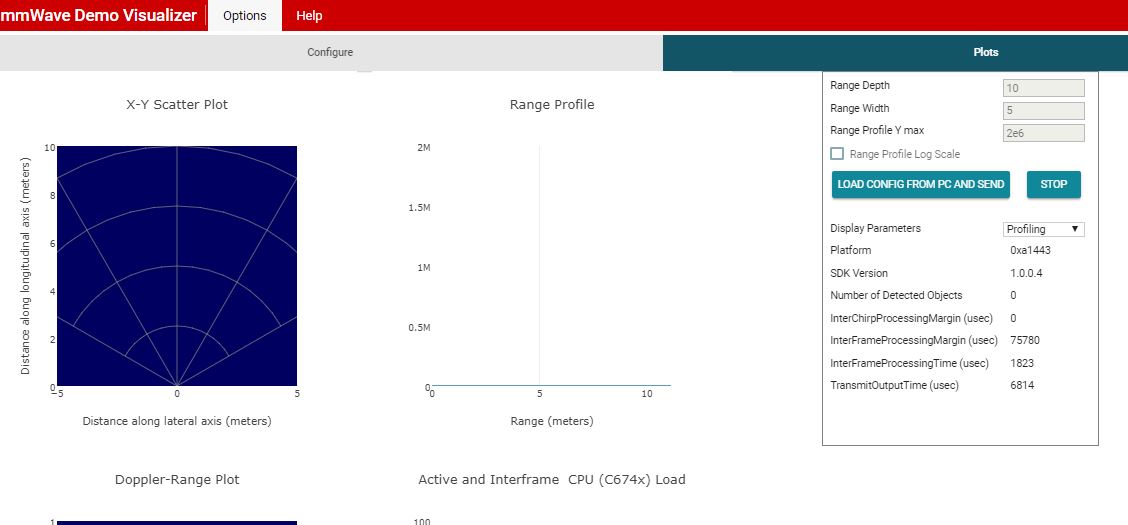
We have just received the IWR1443BOOST EVM. I have connected it to a Windows 7 machine and am attempting to use the module with the basic web software ( dev.ti.com/.../) using Chrome. I have the com ports configured and the device powered up with a 5V power supply. The device is connected and is communicating with the visualizer. Using the default configuration settings, nothing is displayed in the Range Profile. The Active and Interframe CPU load shows Active Frame as 0 and Interframe at about 10%. I can start and stop the unit and see the Interframe go from 0 to 10% when running. Starting and stopping it does not generate any data.

I have watched the video "mmWave SDK EVM Out-of-Box Demo with Kenneth Sy Su" and everything is the same as what he is running, other than the port numbers that is.

The led's are all correct, DS1 is off, DS2 is red, DS3 is yellow when running and DS4 is yellow. Of course the reset button, SW2, was pressed to clear the initialisation error on power up, that is DS1 was red.

I haven't attached the configuration file as it is the default in Visualizer.

We would appreciate any suggestions on how to get this visualizer software working with the EVM.

Thank you,

Dennis


  • Hello Dennis,

    We will have to check what is going on with your particular setup and might need more information.
    Can you please make sure the console window responds when commands are sent via the GUI of visualizer. Another thing to check would be disconnect the device and retry it.

    Thank you,
    Vaibhav
  • Hello Vaihav,

    Thank you for your quick response. The console window is logging when I send the config commands to the device. I have reset it (complete power down) and pressing 2 on power up before starting the visualizer and have not been able to get any signal. I have attached the configuration settings and the console window (took 4 screen captures as I wanted you to see it exactly as shown) and as well 2 of the plot page. on the plot page you can see it is running. I should have attached these on my first post so you had everything.

    I look forward to your response.

    Thank you,

    Dennis

  • Hello Dennis,

    Based on your snapshot for the Visulizer GUI we can notice that the device selected under "Platform" is xWR16xx, whereas you mentioned this was on IWR1443BOOST board.
    Can you please make sure the Platform board selection matches the board you are trying with.

    With the right setup we should be able to see the Range Profile plot populated actively.

    Thank you,
    Vaibhav
  • Vaibhav,
    I have to apologize - not sure how I had missed this, as in my original testing I had set it up but had not reset the device. It is working now and I can begin the real work. Thanks again!!
    Dennis
  • Hi Dennis,

    Glad to know you were able to run the demo! No worries.

    Thank you,
    Vaibhav