


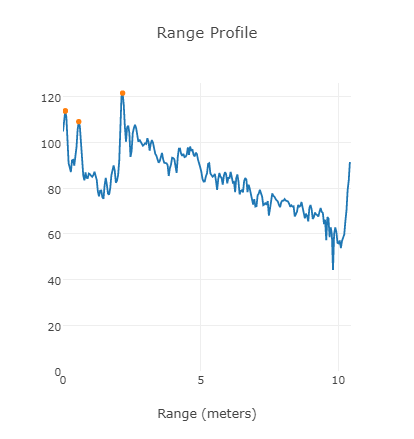
I can get the picture of range profile of the output data like figure 2(log scale), so how can I transform it to figure 1?
Also, where is the (0,0,0) on the board?
I can get the picture of range profile of the output data like figure 2(log scale), so how can I transform it to figure 1?
Also, where is the (0,0,0) on the board?

