This thread has been locked.

If you have a related question, please click the "Ask a related question" button in the top right corner. The newly created question will be automatically linked to this question.

AWR1642BOOST: The angle of "X-Y Scatter Plot" of Demo Visualizer

Guru 16800 points
Part Number: AWR1642BOOST

Hello,

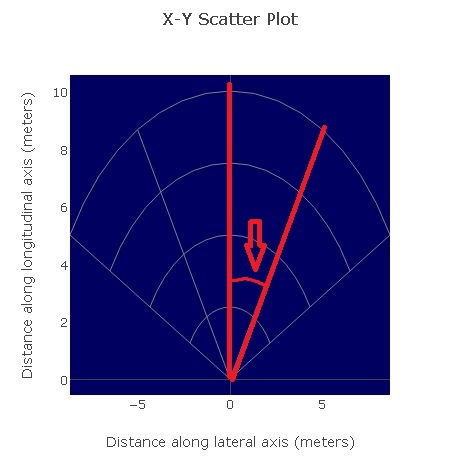
Please let me know the angle drawn in the following figure.
The angle information is used to evaluate AWR1642BOOST.
I guess the angle is 27.5 degree.

Best Regards,

Nomo

  • Hi Nomo-san,

    The angle of each arc is pi/6 radians or 30 degrees. You can view the source code for the visualizer by pressing F12 (or as mentioned in this thread) and look in the file app/mmWave.js. The X-Y scatter plot angles are set in the following code. 

            } else {
                var gridchoice = 'polar grid 2';
                var rectgrid = gridchoice == 'rect grid';
                templateObj.$.ti_widget_plot1.data = [
                    {type: 'scatter', mode: 'markers',
                     marker: {size:4, color: 'rgb(0,255,0)', showscale:false}
                    }
                ];
                templateObj.$.ti_widget_plot1.layout.title = 'X-Y Scatter Plot';
                delete templateObj.$.ti_widget_plot1.layout.margin;
                templateObj.$.ti_widget_plot1.layout.plot_bgcolor = 'rgb(0,0,96)';
                templateObj.$.ti_widget_plot1.layout.xaxis = {
                    title: 'Distance along lateral axis (meters)',
                    showgrid: rectgrid,
                    //zerolinecolor: 'rgb(128,128,128)',
                    autorange: false,
                    range: [-range_width, range_width]
                };
                templateObj.$.ti_widget_plot1.layout.yaxis = {
                    title: 'Distance along longitudinal axis (meters)',
                    showgrid: rectgrid,
                    autorange: false,
                    range: [0, range_depth]
                };
                var radii = [];
                var angles = [];
                if (gridchoice == 'polar grid 1') {
                    radii.push(range_depth);
                    angles.push( math.pi/6 + 0*math.pi*2/12 );
                    angles.push( math.pi/6 + 4*math.pi*2/12 );
                } else if (gridchoice == 'polar grid 2') {
                    for (var i=1; i<=4; i++) {
                        radii.push(i*range_depth/4);
                    }
                    for (var i=0; i<5; i++, idx+=1) {
                        //if (i==2) continue; // skip the main vertical line
                        angles.push( math.pi/6 + i*math.pi*2/12 );
                    }
                }

    You can also download the Visualizer source from https://dev.ti.com/gallery. Click the download button under mmWave_demo_Visualizer and download the zip file for your platform.

    Regards

    -Nitin

  • Hello Nitin-san,

    Thank you for your reply.
    Your answer is helpful.

    Best Regards,

    Nomo