This thread has been locked.

If you have a related question, please click the "Ask a related question" button in the top right corner. The newly created question will be automatically linked to this question.

AFE4300EVM-PDK: questions about the device GUI

Part Number: AFE4300EVM-PDK
Other Parts Discussed in Thread: AFE4300

Hello,

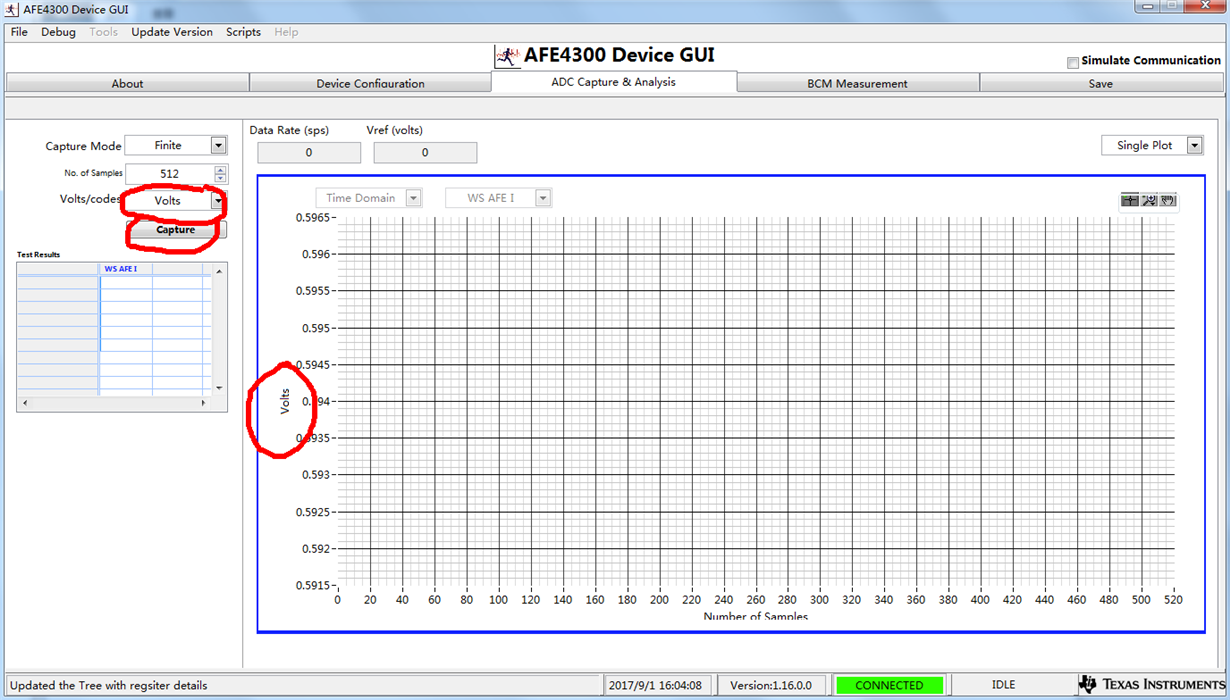
i have some questions about the AFE4300 device GUI. As I show in the first picture, what dose the volt that has been captured stand for? Dose it mean the voltage of the measuring resistor? Or something else?
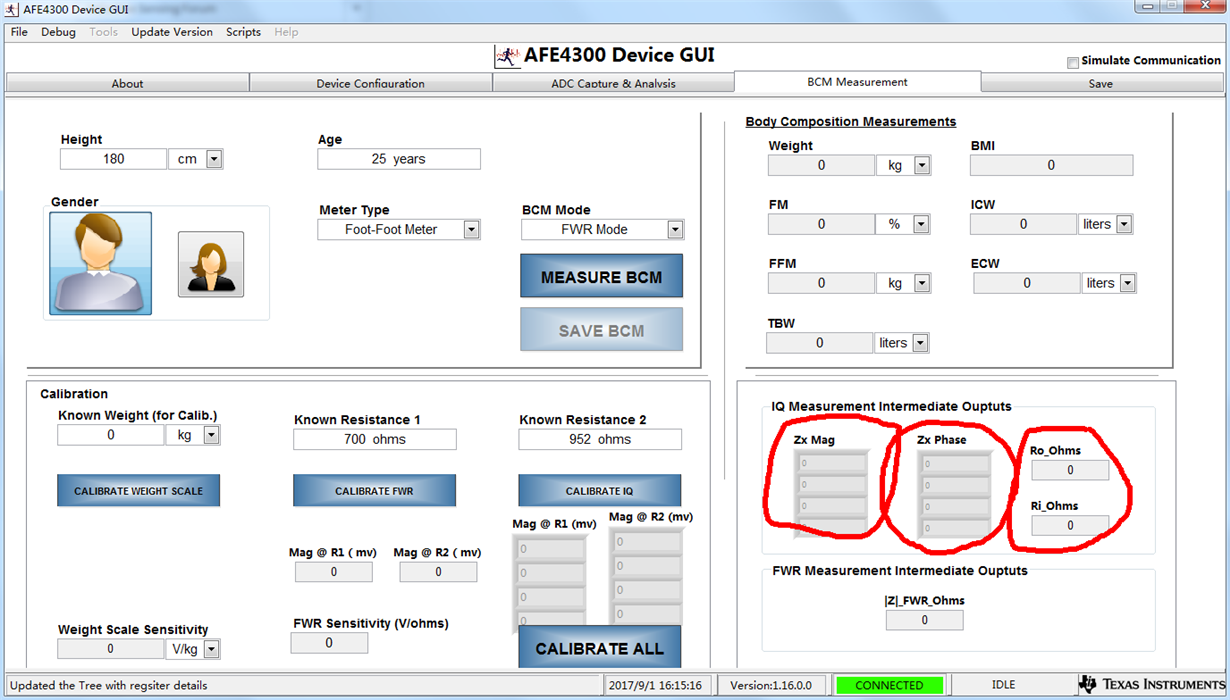
In the second picture, what dose Ro_Ohms and Ri_Ohms mean? Because there are four different frequencies in IQ mode, so what dose the four edits mean in the output(Zx Mag and Zx Phase) from the top to bottom? And how can I save the outputs into a Excel?
Thank you!!!

  • Hello,

    We have received your queries related to the AFE4300EVM GUI and will get back to you with the response soon.
  • Hi,

    I am assuming you are asking with respect to BCM signal chain.
    The voltage is shown in the graph is the demodulated voltage developed across the resistor. This voltage along with the gain and offset ( determined using calibration routine) can be use to determine the impedance value of the unknown resistor/network.

    Ro and Ri are Cole-Cole model parameters , you can refer to following post for the additional details,
    e2e.ti.com/.../2234283

    Zx Mag and Zx Phase are the magnitude and phase of the unknown resistor/network for four different excitation frequency.

    You can save the data using the "Save" tab into the excel sheet.

    Regards,
    Prabin
  • Hi Prabin,

    Thank you very much for your reply.
    1. If I want to know the resistance, what should I do when I have got the voltage? Because I want to get lots of data every time, both FWR mode and IQ mode are too slow to do that.
    2. Would you please tell me the range of DDS Freq?When I test the output with a oscilloscope, the wave is distorted when the freq up to 100k Hz.

    Thanx,

    Chris.
  • Hi,

    You can refer the following post ( April 19, 2017) regarding the calibration routine and how to convert the obtained voltage into the resistance.

    e2e.ti.com/.../2168676

    The maximum data rate that we support is 860 sps. Could you please explain why you need so much data?
    The distortion at 100KHz is caused by the excitation amp due to higher swing.
    One way to improve the signal quality at higher frequency is to reduce the swing by placing an external resistor between the DAC_OUT and DAC_FILT_IN pin.

    Regards,
    Prabin
  • Hi,

    Assuming your query was resolved, I am closing this thread.

    Regards,
    Prabin